基金项目:地震科学联合基金青年基金课题(C08038)
(Earthquake Administration of Fujian Province,Fuzhou 35003,China)
seismic intensity; attenuation relation; contrast analysis; Fujian and its adjacent areas
备注
基金项目:地震科学联合基金青年基金课题(C08038)
对福建及邻近地区地震烈度资料进行等效处理、近远场补点、数据加权处理,改进衰减模型和统计方法,加强了对大震近、远场的控制,建立了适合本地区的地震烈度衰减关系,并对比分析了Ra和Rb取值、补点和加权对烈度衰减关系的影响。
Based on the seismic data of Fujian and its adjacent areas through the equivalent process,auxiliary point of the near-far field and data weighting,the statistic method and the attenuation model has been improved and the near-far field control to large earthquake has been strengthened.An intensity attenuation relation suitable to the areas has been established,and further the influence of Ra and Rb,auxiliary point and weighting to the intensity attenuation relation is contrasted and analyzed.
引言
地震烈度衰减关系是地震安全性评价和标度历史地震震级标度工作中十分重要的内容,同时也是在震后趋势快速判定中,制作“安全图”、“有感图”和进行震害评估的重要依据。因此,今后一段时期内,研究不同区域地震烈度衰减关系,对地震安全性评价、地震动区划以及震害预测等仍是不可或缺的。
众所周知,不论是地震烈度还是地震动峰值,衰减关系都有强烈的地区性(胡聿贤,1999)。然而,福建地区至今所运用的烈度衰减关系,还是参照华南地区的。鉴于此,本文根据福建及邻近地区地震资料,通过数据处理和对衰减模型及统计方法的改进,建立了本地区的地震烈度衰减关系。
1 福建及邻近地区的地震烈度资料
1.1 资料选取资料主要来自于《东南沿海地震活动特征》(魏柏林等,2001)、《中国历史强震目录(公元前23世纪~公元1911年)》(闵子群等,1995)、《中国近代地震目录(1912年~1990年MS≥4.7)》(汪素云等,1999)和《中国地震烈度等震线图集》(邓起东等,1979)等,选用了包括较可靠的历史大震在内的18次M≥4地震,共45条烈度等震线数据(表1、图1)。之所以这样选取资料,
主要基于以下考虑:(1)由于用烈度等震线数据拟合烈度衰减关系时,选用的地震样本要求震级和烈度都应是独立测定的,因此,大部分烈度资料选用了近代有仪器测定震级的地震。
(2)由于研究区近代的地震几乎都为中强震,缺乏大震,为了达到对烈度衰减关系中大震近、远场的控制,本文选用了目前研究较多且较可靠的3个历史地震。
(3)由于福建绝大多数地震等震线图形呈椭圆形,适用椭圆衰减模型,故没有选用内圈等震
线形状不规则、分不出长短轴方向的地震。
(4)根据胡聿贤等(1999)的研究,在进行地震危险性分析时,起算震级取4级,因此只选用了M≥4的地震烈度等震线资料。
(5)对于同一地震序列的主震与强余震均有等震线资料,只选用可靠性较大的主震等震线资料。
(6)福建地区由于等震线样本较少,为增加样本量,将与闽西地区构造环境基本类似的赣东地区的地震等震线作为本区域样本,其它区域亦选用了个别邻近福建省边界的地震等震线资料。
1.2 资料处理在考虑烈度等震线自身的特性和不确定性的情况下,对上述资料进行处理,处理原则如下:
(1)烈度等效处理
通常用烈度等震线确定的平均估计值比原始烈度点的平均值高0.5~1度,由于方差是从经光滑处理过的外包线而得,故要比原始资料的离散程度小(霍俊荣,1989)。为此,本文采用霍俊荣(1989)提出的回归前要对等震线资料进行处理,修正为等效的原始点资料的方法,将每一组数据(M,R,I)另赋一组数据(M,R,I)作为一组新数据。这样处理的意图在于修正烈度分布的平均值和补偿原始烈度分布的离散程度,尽量满足实际情况。
(2)近、远场补点
通常情况下,烈度在极震区内是饱和的,在远场等震线形状趋于圆形,为了使衰减曲线达到这样的要求,常需对等震线数据进行近、远场补点。近场补点仅在震中烈度为7度以上和最内圈等震线半径大于5 km的情况下进行,远场补点取有感范围的半径和有感烈度值作为远场控制点(俞言祥等,2004)。在这里,近场补点中最内控制点的烈度值由本地区震级—震中烈度关系式确定; 远场补点以使远场衰减曲线近于圆形为止,本文取有感烈度(3~4度)的平均值(3.5度)作为远场控制点。
M=0.65I0+0.84;(1)
lgR=-2.803+0.974M,(M≤5);(2)
lgR=0.611+0.289M,(M >5).(3)
根据上述关系式(马骏驰,2004; 汪素云,1993)和表1,得出补点结果:近场补点3个,远场补点18个。补点后的烈度资料分布情况示于图2。
(3)数据加权处理
由图2可见,多数数据集中在中等震级和中等烈度范围内,样本分布明显不均。为了提高统计结果在样本集合边缘处的置信度,防止因数据分布不均带来的影响,同时考虑数据量的要求,在衰减关系拟合中,本文采用震级和烈度统一分档加权的方案(霍俊荣,1989)。然而,随之而来的一个问题就是要合理地实施数据的分档,处理不好有可能使得各分档区间内的记录数量差别很大,致使某一记录的权重相当于另外好几条记录的权重。为此,本文在采用该方案回归烈度衰减关系时,考虑到烈度资料的具体特点,在比较了几种分档方案之后,把震级分为3档:4~4.9级、5~5.9级、6~7.9级; 把烈度分为3档:小于等于Ⅳ度、Ⅴ~Ⅵ度、Ⅶ~Ⅹ度(表2)。这样处理的意图是使每个区间的数据对最终的回归结果都具有相同的贡献。
2 地震烈度衰减规律的建立
2.1 地震烈度衰减模型在地震烈度衰减关系的确定中通常将地震震源假设为点源,地震烈度衰减取椭圆模型。因此,衰减曲线在起始点是重合的,在中间距离上长、短轴之间有差别(椭圆形); 到了远场,由于发震构造的影响已经消失,烈度等震线趋于圆形,长、短轴衰减曲线也趋于重合。故本文在地震烈度衰减关系的回归分析中,采用椭圆长、短轴联合衰减模型(陈达生等,1989),以保证长、短轴在R=0时烈度相等,而中间距离仍保持长、短轴烈度的差别,同时在远场也使等震线成圆形。联合衰减模型的衰减方程为
I=A1+A2M+A3lg(R1+Ra)+A4lg(Rs+Rb)+ε.(4)
式中:I为地震烈度; M为震级; Ra和Rb分别为长、短轴两方向烈度衰减的近场饱和因子; R1和Rs分别是烈度为I的椭圆等震线的长半轴和短半轴长度; A1,A2,A3,A4为回归系数; ε为回归分析中表示不确定性的随机变量,通常假定为正态分布,其均值为0,标准差为σ。
2.2 Ra和Rb值的确定由于表1中地震的震源深度资料不全,导致对烈度衰减的近场饱和因子Ra和Rb的取值存在困难。为得到能较客观反映本地地震烈度衰减规律的结果,本文分两种情况考虑Ra和Rb的取值,一是参考林金瑛等(2005)对华南地区进行地震烈度衰减关系研究中的取值,Ra和Rb分别取20 km和14 km; 另一种是参考汪素云等(2000)对我国东部地区进行地震烈度衰减关系研究中的取值,Ra和Rb分别取24 km和9 km。
2.3 统计方法经典最小二乘法回归原则是使随机量的误差在统计意义上最小,但该方法不具备抗差性(姚宜斌等,2002)。在地震烈度衰减关系的回归统计中,人们只是习以为常地采用一批现有的观测数据,其中包括地震烈度参数、震级和距离,故当样本存在误差时,必将对整个回归方程的参数估计产生破坏性影响,因此有必要增加回归分析的抗差性。而稳健估计不像最小二乘估计那样追求参数估计在绝对意义上的最优,而是在抗差前提下的最优或接近最优(姚宜斌等,2002)。基于上述考虑,本文统计分析采用稳健回归法。
3 结果讨论
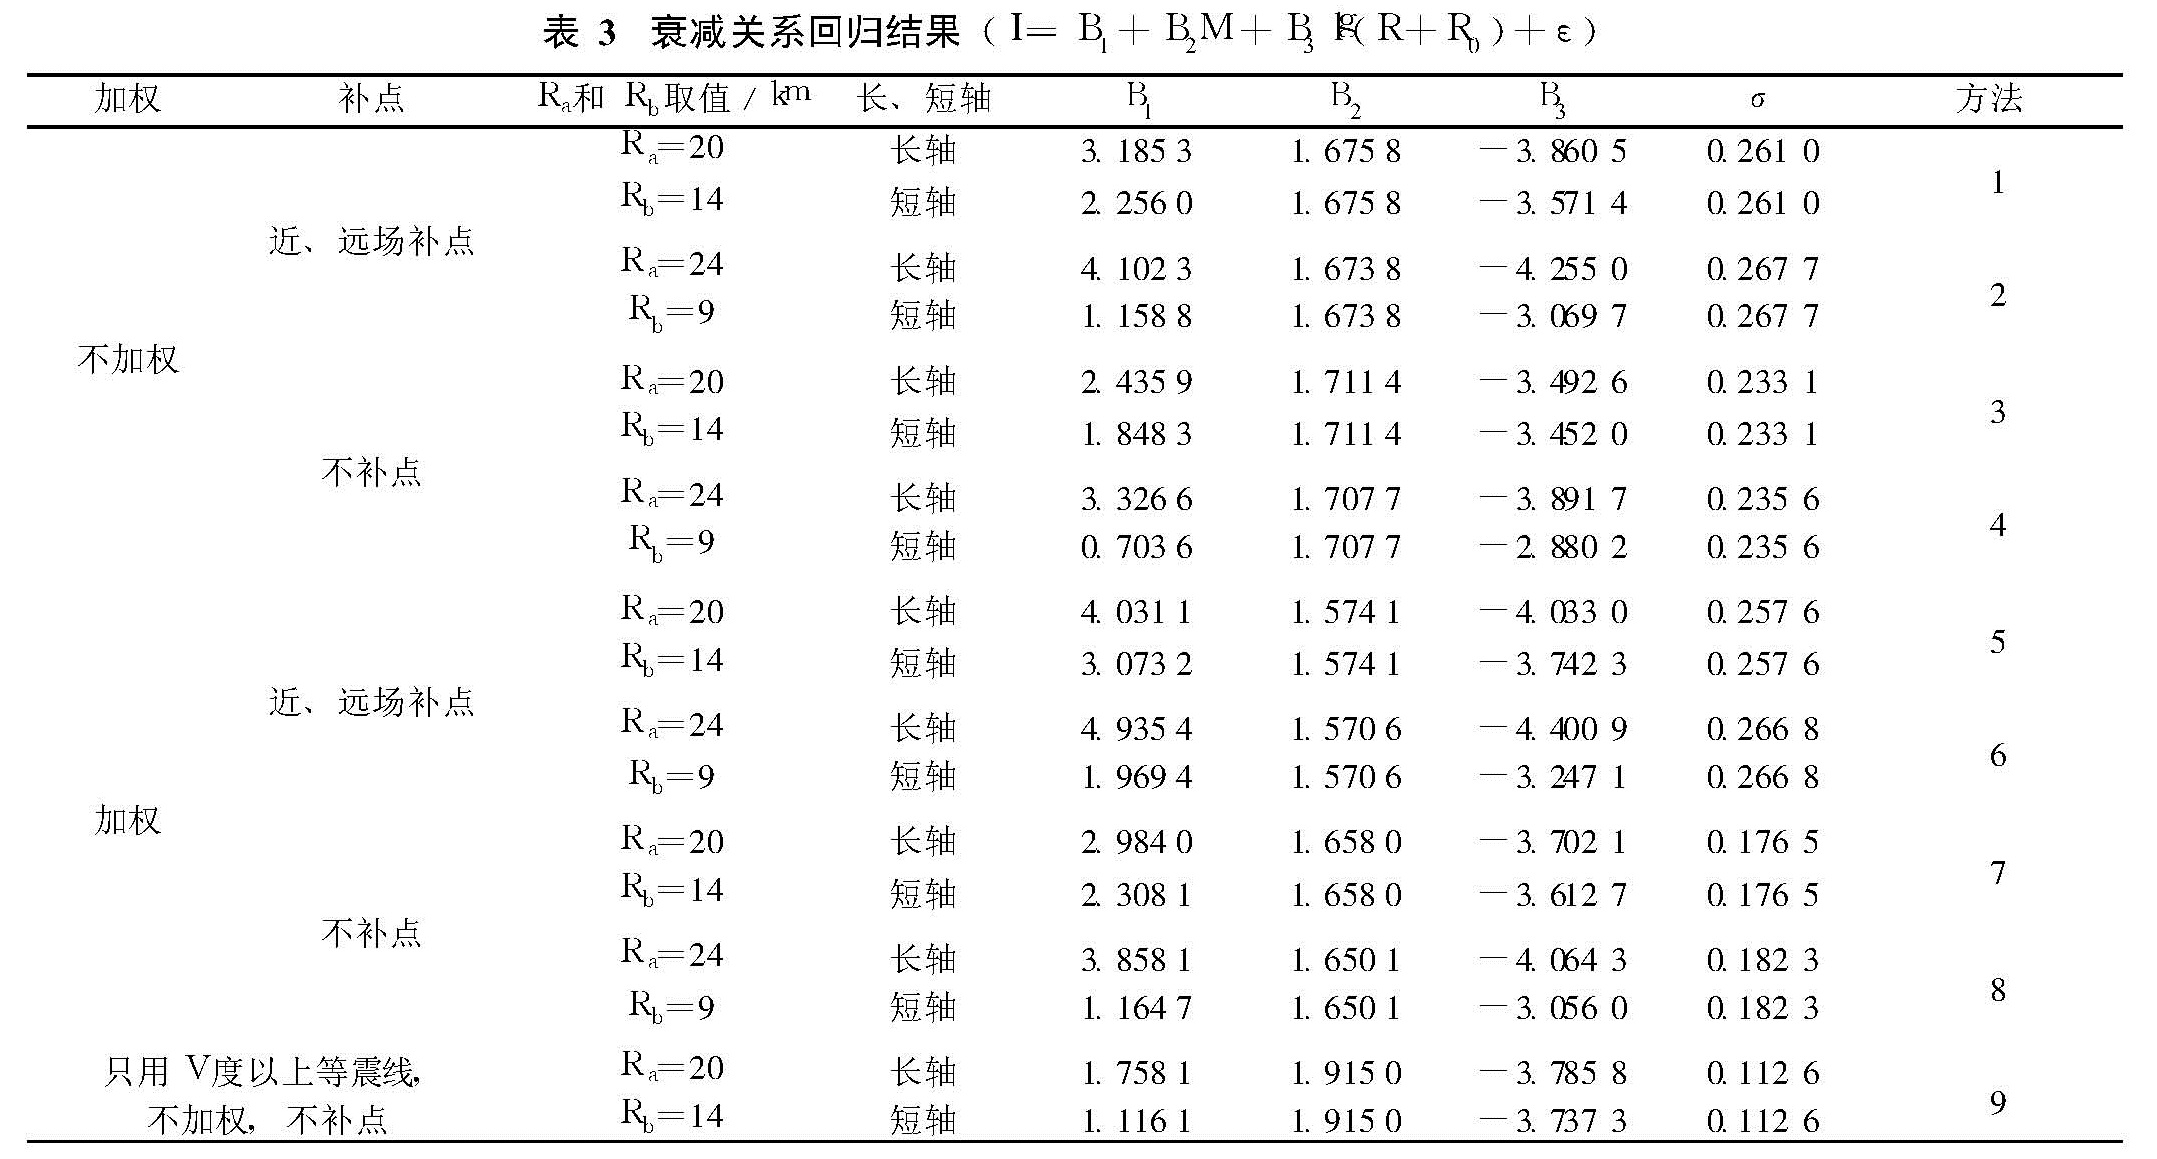
3.1 与不同资料处理方法和Ra、Rb取值对应的衰减关系比较考虑到烈度等震线和震源深度的不确定性,以及在同等情况下,烈度是否等效处理只影响B1,且刚好相差为1(李英民等,2007),故笔者用近、远场
补点、数据加权和Ra、Rb取值作为影响因数,对本地区烈度衰减关系进行了研究。表3对不同资料处理方法与Ra、Rb取值对应的统计结果作了汇总。值得一提的是,本文不把统计方法纳入为影响因素,是因为在样本数量不是特别多的情况下,统计方法的不同对衰减结果影响不是特别大(李英民等,2007)。
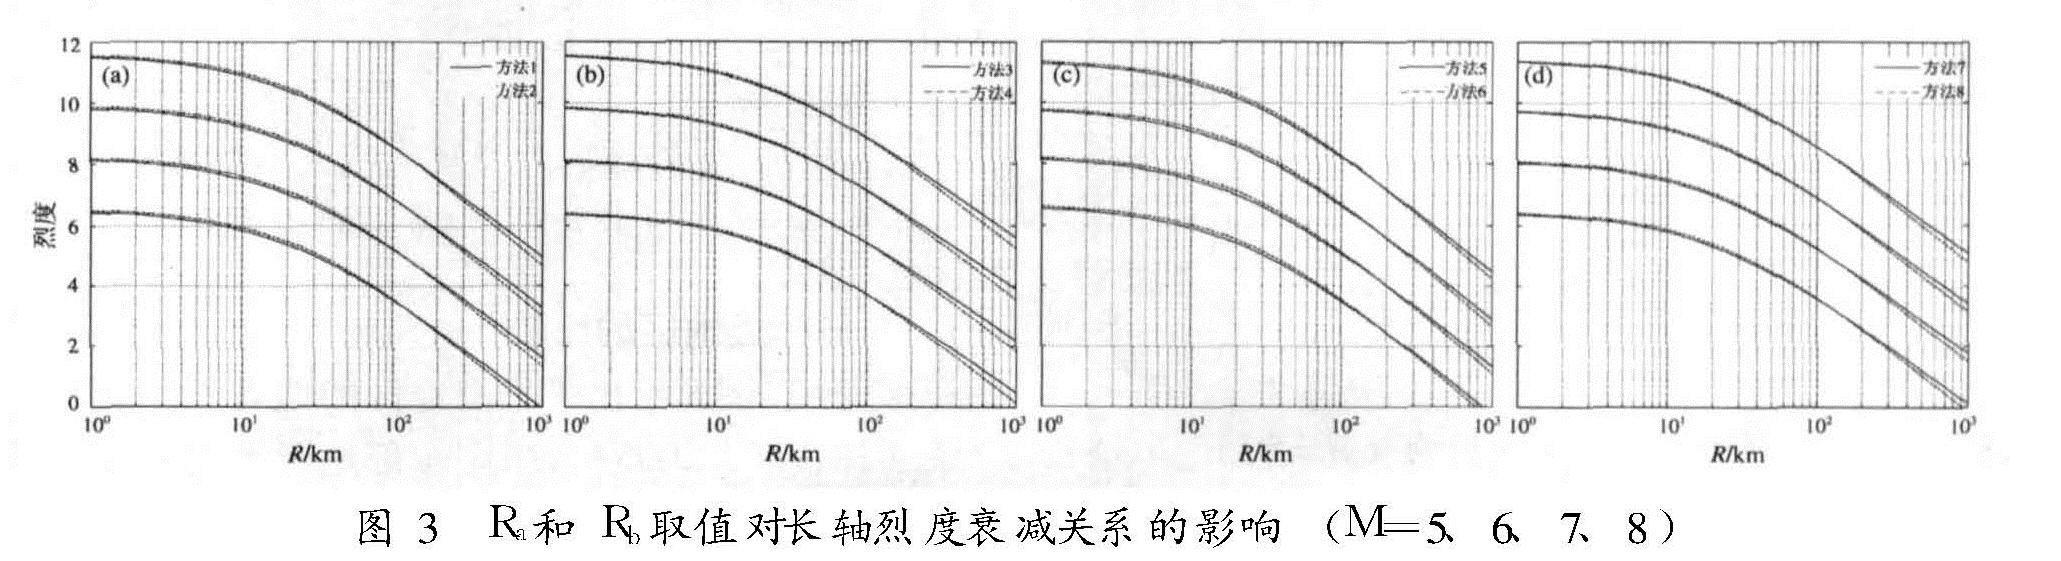
(1)由图3和图4可见,在同等情况下,Ra、Rb取值对烈度衰减关系影响不大,仅在远场会
图3 Ra和Rb取值对长轴烈度衰减关系的影响(M=5、6、7、8)
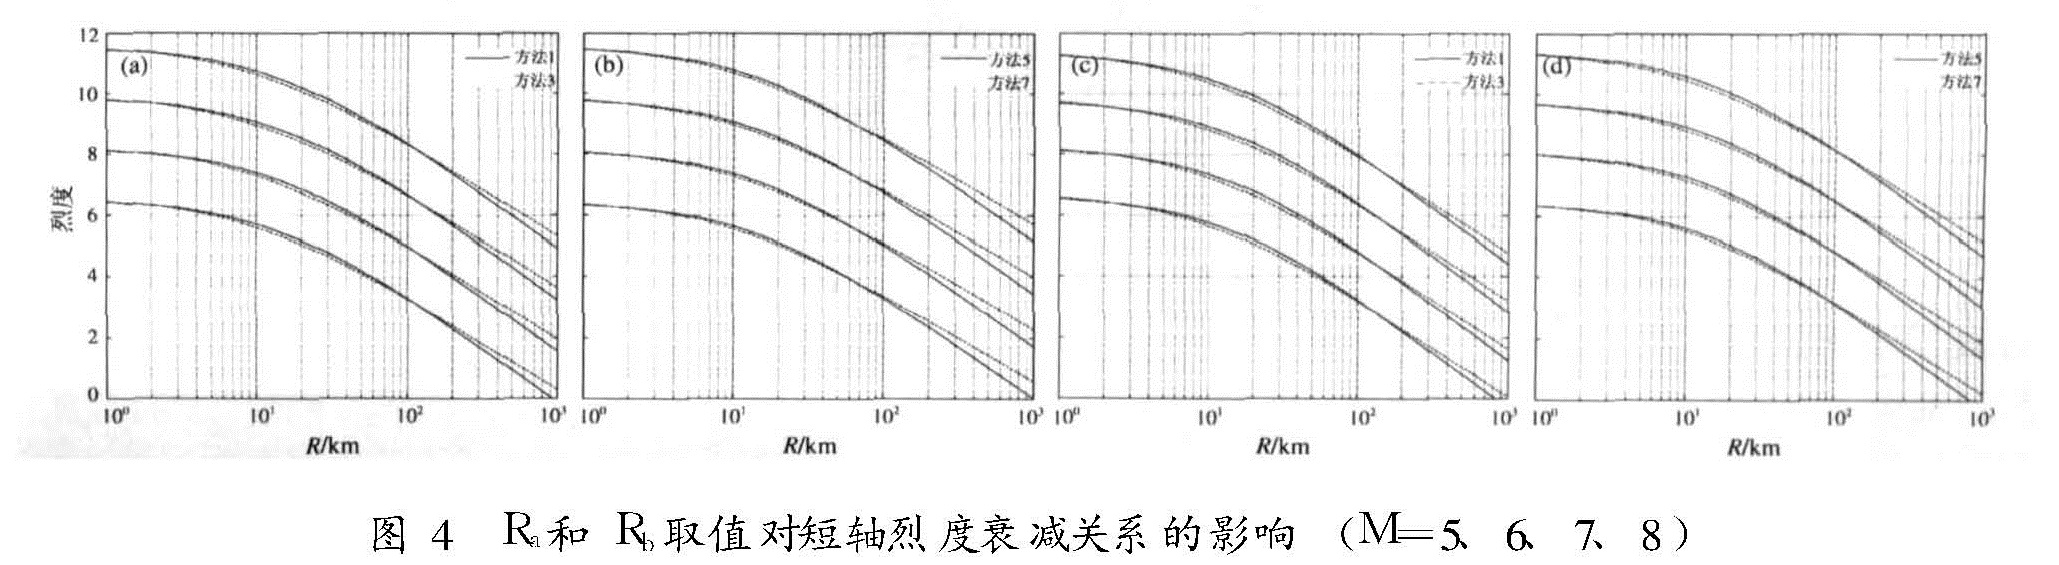
图4 Ra和Rb取值对短轴烈度衰减关系的影响(M=5、6、7、8)
有0.1度左右的差别。但如果以σ为评判标准,由表3可见,在同等情况下,回归结果中Ra和Rb分别取20 km和14 km对应的σ比分别取24 km和9 km对应的σ小,据此判断Ra和Rb分别取20 km和14 km更符合本地区的震源深度特征。
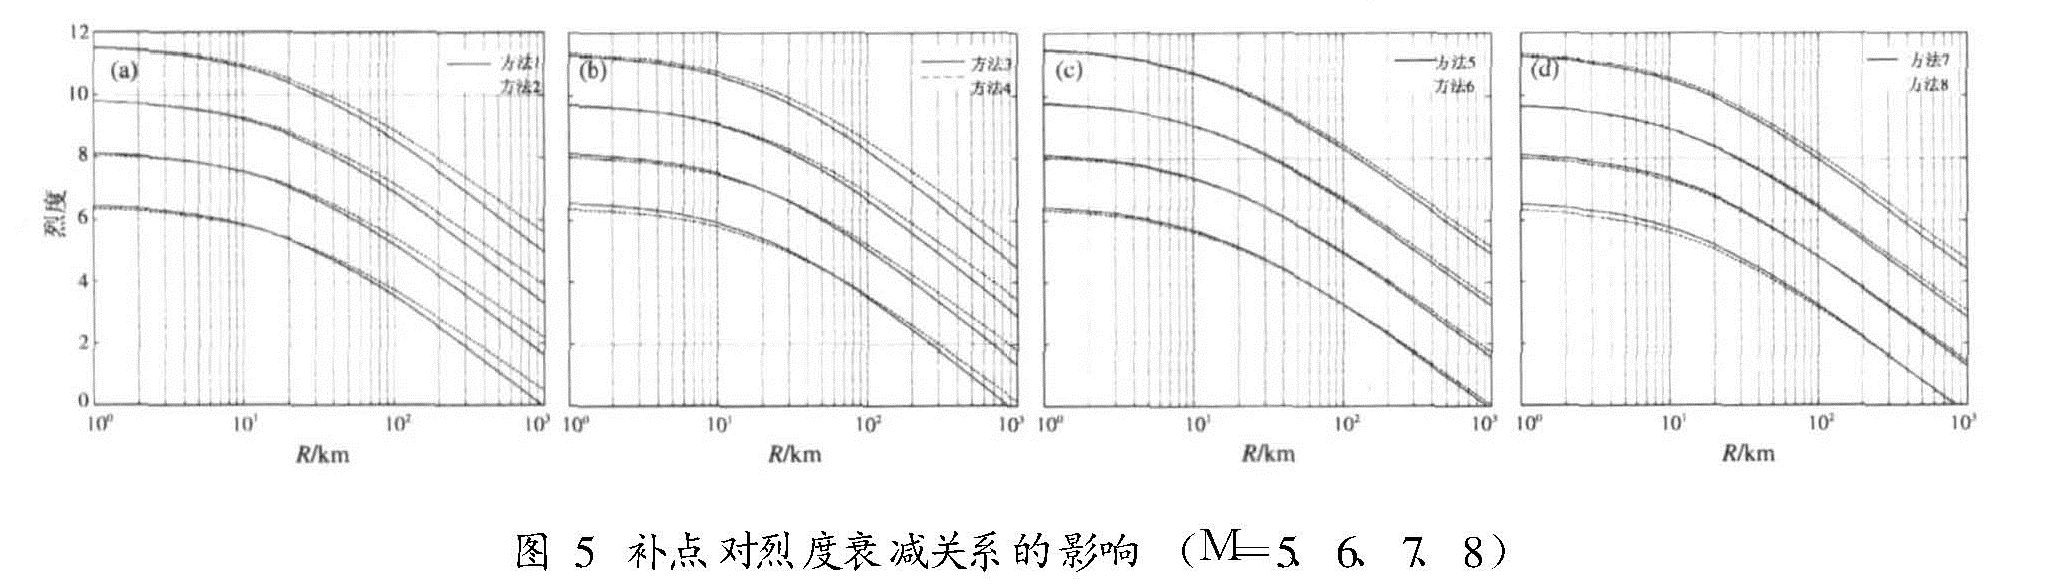
(2)从图5可知,补点对烈度衰减关系远场有一定的影响。其原因是通过远场补点,增加3.5级地震的样本,使样本对远场的控制得到加强,导致补点后的衰减关系在远场衰减加快; 而由于近场补点较少,增加的样本量与补点前相比不足1/10,故不对近场产生影响。回归前对等震线进行近、远场补点既反映了烈度等震线特性,又同现有观测资料一致,从而使统计结果达到目前认知水平的要求。
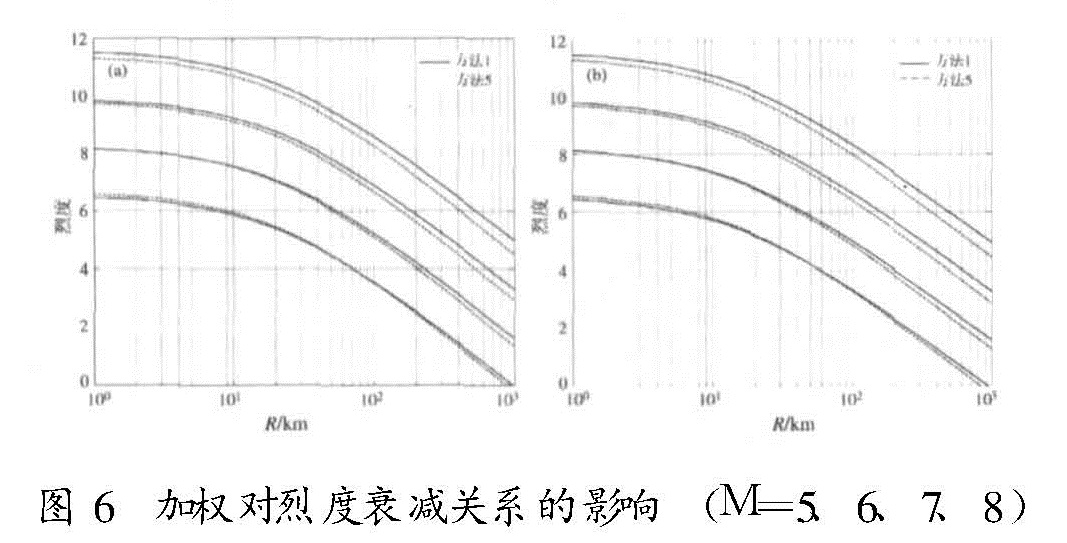
(3)图6绘出了加权对烈度衰减关系的影响,可知对于中强地震(M5~6),方法1和方法5二者相差不大; 对于强地震(M7~8),加权结果比不加权结果高。其原因是本地区地震烈度资料分布不均,强地震烈度数据量相对较少,通过加权后,致使强地震烈度数据量增加,加强了对衰减关系中大震级的控制而导致上述结果。诚然,通过对数据加权处理,即对数据样本进行优化得到的统计结果具有更高的置信度。
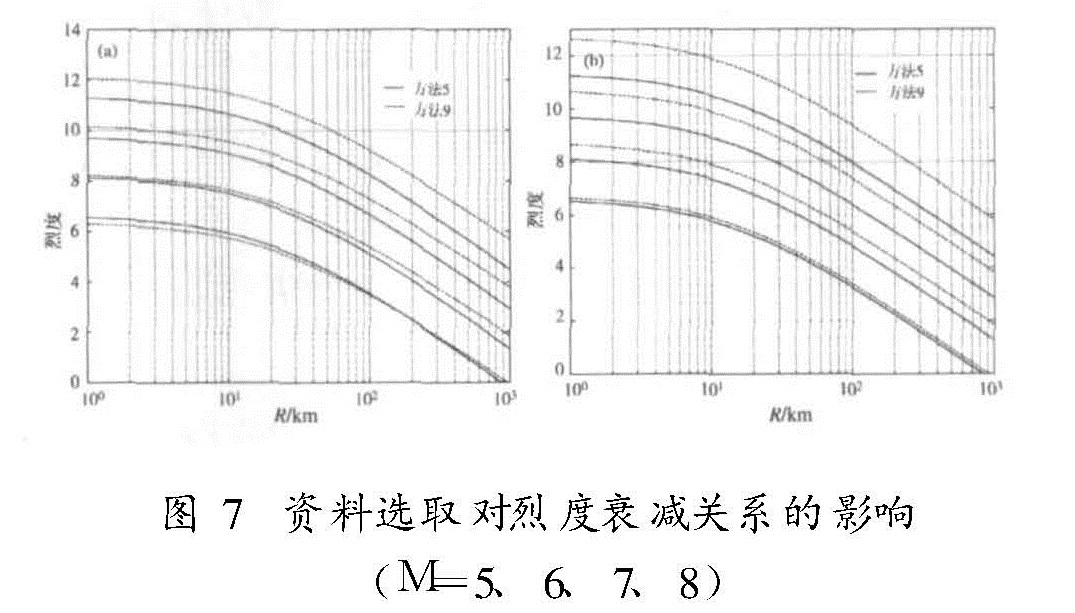
(4)据图7可知,烈度资料选取不同对中强地震(M5~6),方法5和方法9二者相差不大; 对强地震(M7~8),方法9结果比方法5高。其主要原因是,方法9中在近、远场未补点,加上由于样本分布不均匀,在中场处较多,近、远场处较少,导致近、远场处均是中场的外推,特别是对大震近场控制不足,使得大震近场短轴处烈度超过Ⅻ度,这和烈度在极震区内呈饱和现象相悖。《建筑抗震设计规范》(GB 50011-2001)规定VI度及以上才设防,从抗震角度出发,使用V度以上的等震线资料建立烈度衰减关系更能反映本地区强震的烈度特征。但由于资料还不够充分,特别是缺少可靠的强震烈度资料,使得该区强震的烈度衰减关系还有待数据的积累和更新。
3.2 与相近地区的比较
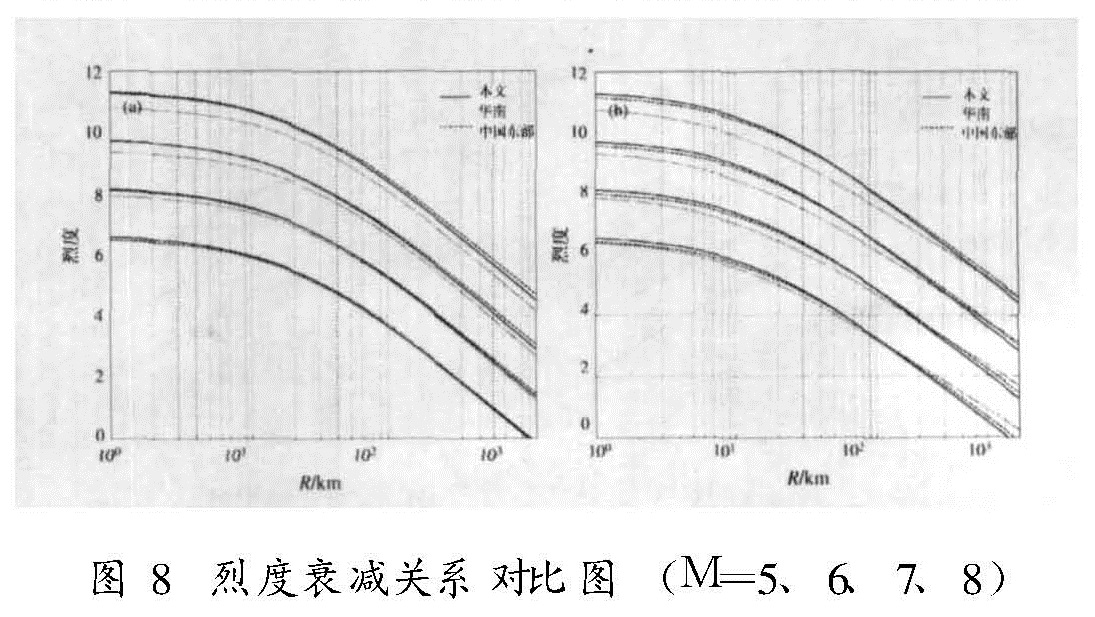
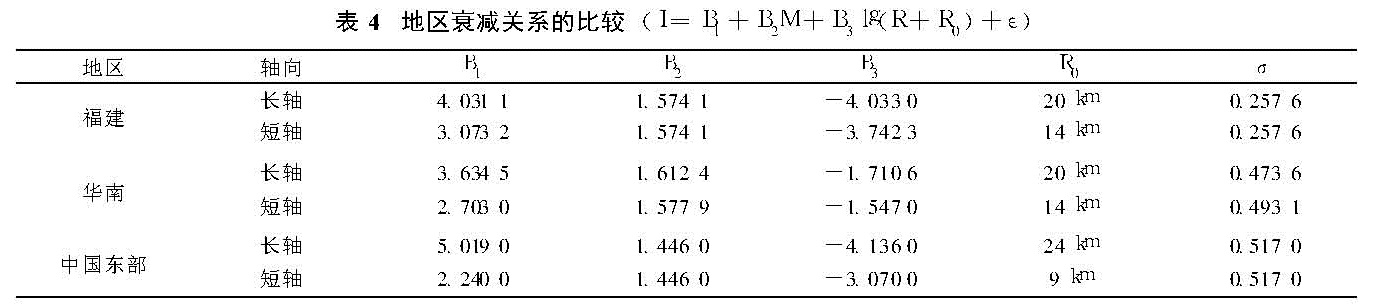
表4、图8给出了华南地区的地震烈度衰减关系(林金瑛,2005)、中国东部地区地震烈度衰减关系(汪素云等,2000)和本文研究的对比结果。
表4 地区衰减关系的比较(I=B1+B2M+B3lg(R+R0)+ε)
(1)对于中强地震(M5~6),三者相差不大; 对于强地震(M7~8)近场,福建地区与华南地区的衰减关系相近,比中国东部地区高; 对于强地震(M7~8)中远场,福建地区介于华南地区与东部地区之间。
(2)至于衰减曲线的曲率即衰减的快慢,三者基本持平,只是中国东部地区在短轴远场会稍高一些。
3.3 与以往的类似工作不同之处(1)以福建及邻近地区为研究区域。
(2)在选取地震资料时,选用较可靠的3个历史强震及有近代仪器测定震级的地震。
(3)在统计分析前,对烈度资料进行近、远场补点和烈度等效处理,以及数据加权处理。
(4)在衰减模型上采用了椭圆长、短轴联合衰减模型。
(5)统计方法上采用稳健回归法。
综上所述,与邻近地区相比,衰减规律既有差异性,又有相似性。但本文通过数据处理、衰减模型和统计方法的改进,加强了对大震近、远场的控制,使得大震近、远场的拟合效果有了明显的改善,这不但对于本地区强地震预测具有现实意义,而且为本地区地震危险性分析和地震小区划提供了一套更为合理的烈度衰减关系。
4 结语
地震动的衰减规律受震源机制、传播介质和场地条件等诸多因素影响,具有明显的区域性。本文根据福建及邻近地区的地震烈度资料,通过资料处理、衰减模型和统计方法改进,建立了本地区的地震烈度衰减关系。其具有如下特征:
(1)与不同资料处理方法和近场饱和因子Ra、Rb取值对应的衰减关系进行比较,结果表明:在同等情况下,Ra和Rb取值对烈度衰减关系影响不大,补点和加权均对烈度衰减关系有一定的影响。
(2)与相近地区相比,烈度衰减关系既有差异性,又有相似性。但本文通过选用目前研究较多且较可靠的3个历史强震以及数据处理、衰减模型和统计方法的改进,加强了对大震近、远场的控制,使得大震近、远场的拟合效果有了明显的改善,这不但对于本地区强地震预测具有现实意义,而且为本地区地震危险性分析和地震小区划提供了一套更为合理的烈度衰减关系。
应该看到,现有资料还不够充分,特别是缺少可靠的强震烈度资料,该区强震的烈度关系的研究还有待数据的积累和更新。
- 陈达生,刘汉兴.1989.地震烈度椭圆衰减关系[J].华北地震科学,7(3):31-42.
- 胡聿贤主编.1999.地震安全性评价技术教程[M].北京:地震出版社.
- 国家地震局全国地震烈度区划编图组汇编.1979.中国地震烈度等震线图集[M].北京:地震出版社.
- 霍俊荣.1989.近场强地面运动衰减规律的研究[D].哈尔滨:国家地震局工程力学研究所.
- 高振世,朱继澄,唐九如,等.2000.建筑结构抗震设计[M].北京:中国建筑工业出版社.
- 林金瑛,王善雄,林锦华.2005.华南沿海地区地震烈度衰减关系[J].海峡地震,3(1):1-9.
- 李英民,蔡辉腾,韩军,等.2007.重庆及邻近地区地震烈度衰减关系研究[J].防灾及减灾工程学报,27(1):17-22.
- 马骏驰,窦远明,苏经宇,等.2004.东南沿海地区震级与震中烈度的统计关系[J].世界地震工程,21(4):119-122.
- 闵子群主编.1995.中国历史强震目录(公元前23世纪~公元1911年)[M].北京:地震出版社.
- 汪素云,时振梁.1993.有感半径与震级的关系及其应用[A].国家地震局震害防御司编.中国地震区划文集 [C].北京:地震出版社,179-184.
- 汪素云,吴戈,时振梁主编.1999.中国近代地震目录(公元1912年~公元1990年MS≥4.7)[M].北京:中国科学技术出版社.
- 魏柏林主编.2001.东南沿海地震活动特征[M].北京:地震出版社.
- 俞言祥,汪素云.2004.青藏高原东北地区水平向基岩加速度峰值与反应谱衰减关系[J].地震学报,26(6):591-600.
- 汪素云,俞言祥,高阿甲,等.2000.中国分区地震动衰减关系的确定[J].中国地震,16(2):99-106.
- 姚宜斌,陶本藻,施闯.2002.稳健回归分析及其应用研究[J].大地测量与地球动力学,22(2):16-19.