例1.台湾宜兰地震
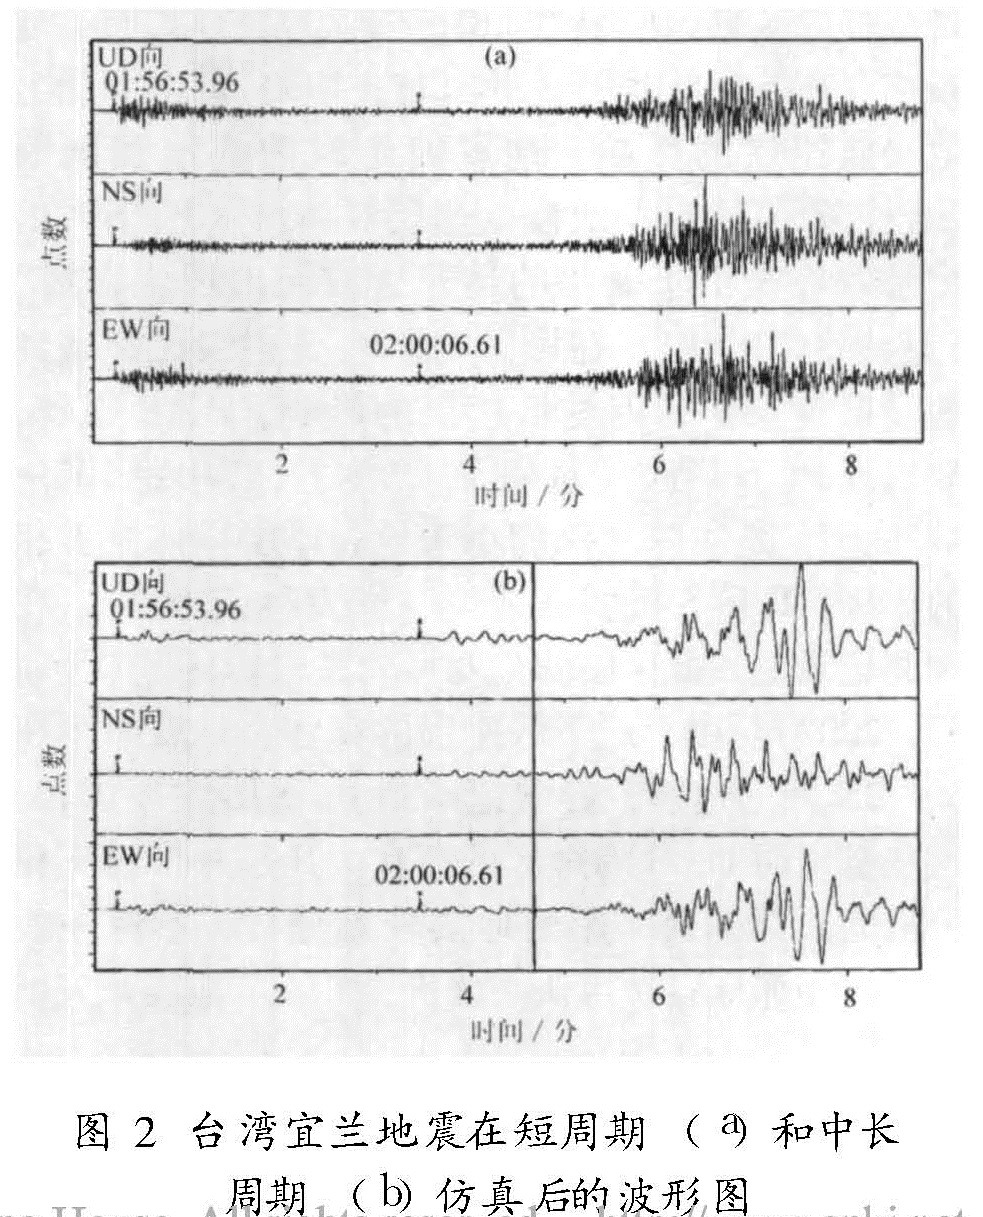
发震时刻:2003-06-09 01:52:52.8; 震中位置:25.1°N, 122.4°E; 震级:MS5.0; 震中距:17.32°; 震源深度:33 km。
图2 台湾宜兰地震在短周期(a)和中长周期(b)仿真后的波形图
分析出P、S波后,由DIMAS软件自动计算出地震基本参数:Origin Time=2003.06.09 01:52:54.789; Depth=33 km; Distance=17.32°(以下几个图例做法相同)。分析得到的S波到时才与用标准的发震时刻确定的S波到时接近,从图2可以看出,这里S波到时并不清楚,振幅很微弱,几乎分析不出S波到时,只能从运动学方面看出地震波的周期稍有变化。
例2.台湾花莲以东海中地震
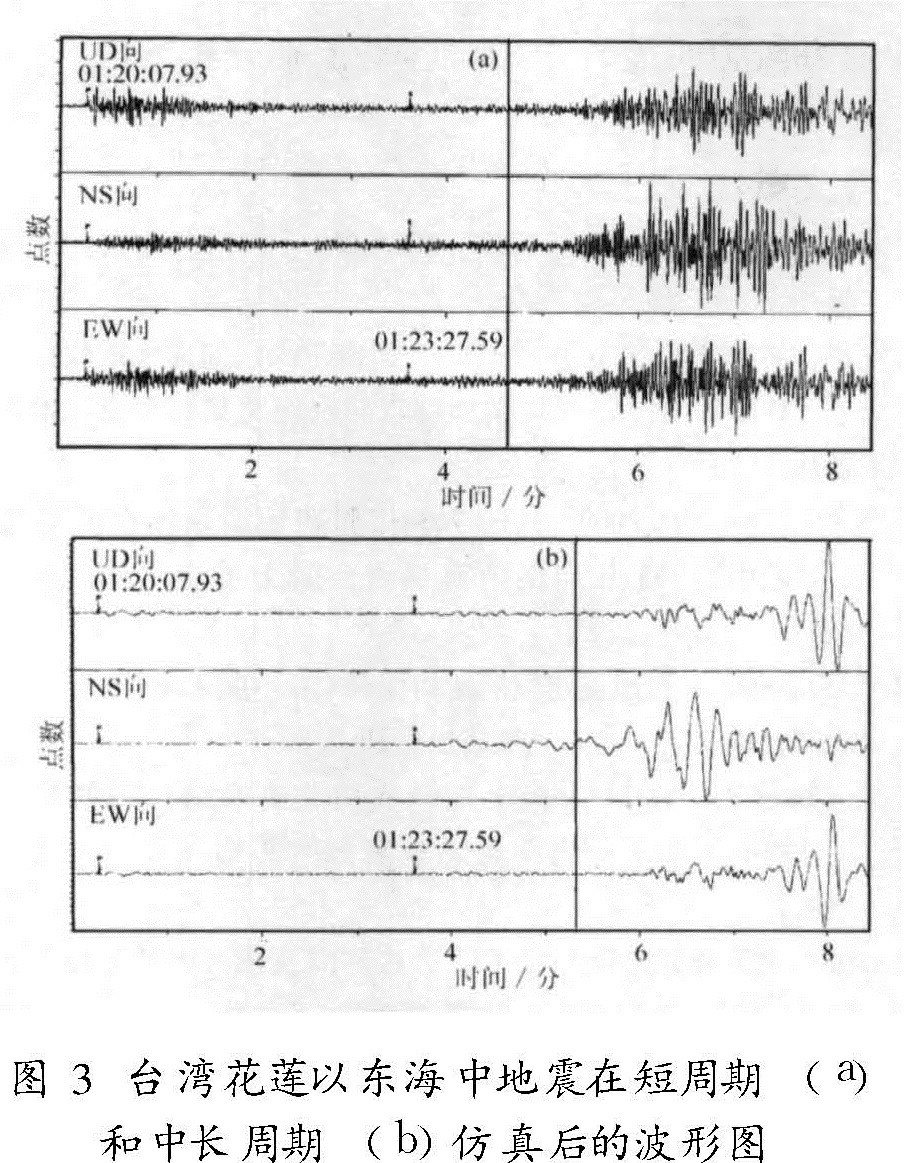
发震时刻:2005-09-06 01:16:00.0; 震中位置:24.1°N,122.1°E; 震级:MS5.8; 震中距:17.92°
分析出P、S波后,由DIMAS软件自动计算出地震基本参数:Origin Time=2005.09.06 01:16:01.252; Depth=33 km; Distance=17.92°。从图3看出,S波并不清楚,它出现在振幅明显变大之前,运动学中周期稍变大之处,这里S波到时和由标准的发震时刻确定的S波到时很接近。
图3 台湾花莲以东海中地震在短周期(a)和中长周期(b)仿真后的波形图
例3.西藏班戈地震
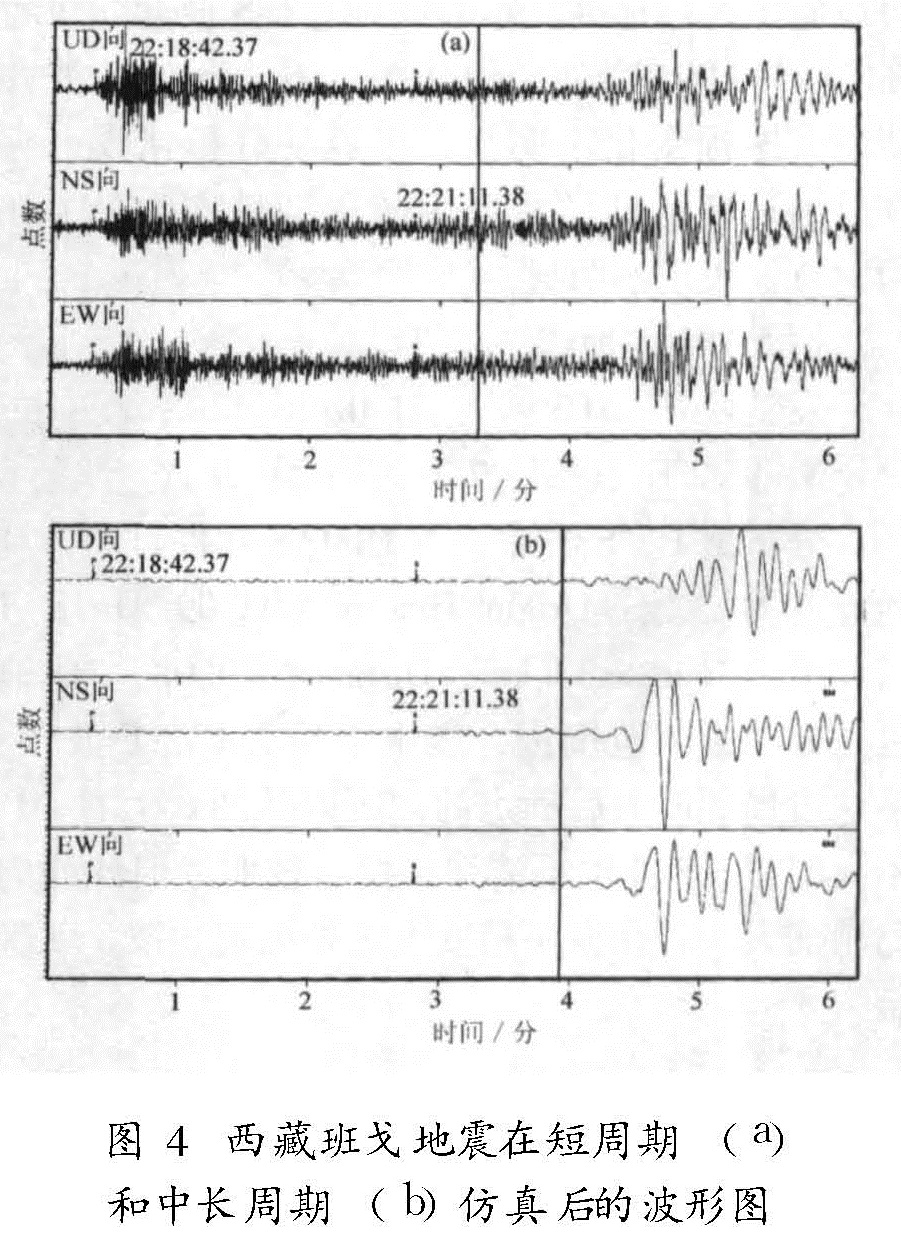
发震时刻:2003-01-16 22:15:33.5; 震中位置:32.8°N,90.2°E; 震级:MS5.0; 震中距:13.44°。
分析出P、S波后,由DIMAS软件自动计算出地震基本参数:Origin Time=2003.01.16 22:15:33.991; Depth=33 km; Distance=13.44°。从图4看出,S波到时基本看不清楚,按平常的分析法,震相S可能会在22:21:31处,图中正确的S波应在22:21:11处。S波到时位置比在大震幅起点的地方提前了20 s。所以,在这种情况下,一般是很难准确分析S波的。此地震S波是出现在南北向中周期略变大的地方。
图4 西藏班戈地震在短周期(a)和中长周期(b)仿真后的波形图
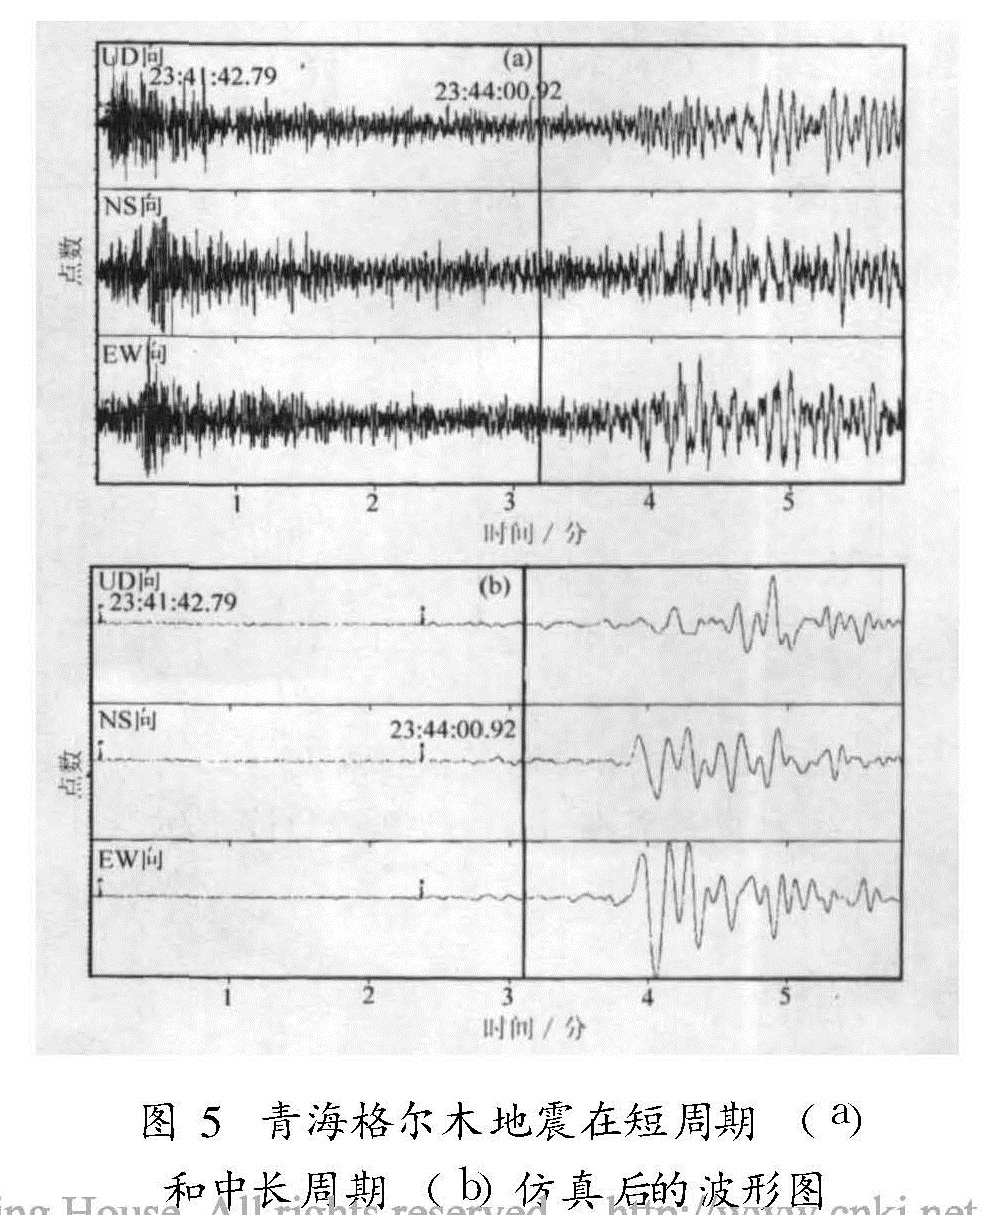
例4.青海格尔木地震
发震时刻:2006-03-29 23:38:49.4; 震中位置:35.5°N,95.4°E; 震级:MS5.2; 震中距:12.42°。
图5 青海格尔木地震在短周期(a)和中长周期(b)仿真后的波形图
分析出P、S波后,由DIMAS软件自动计算出地震基本参数:Origin Time=2006.03.29 23:38:48.273; Depth=33 km; Distance=12.42°。从图5可以看出,按标准发震时间推算,S波起始位置应在23:44:00.92处,但从图上看,此处S波并不清楚,振幅变化不明显,很容易分析错误,它基本是出现在运动学特征中的周期稍变大处,在动力学方面表现不明显。
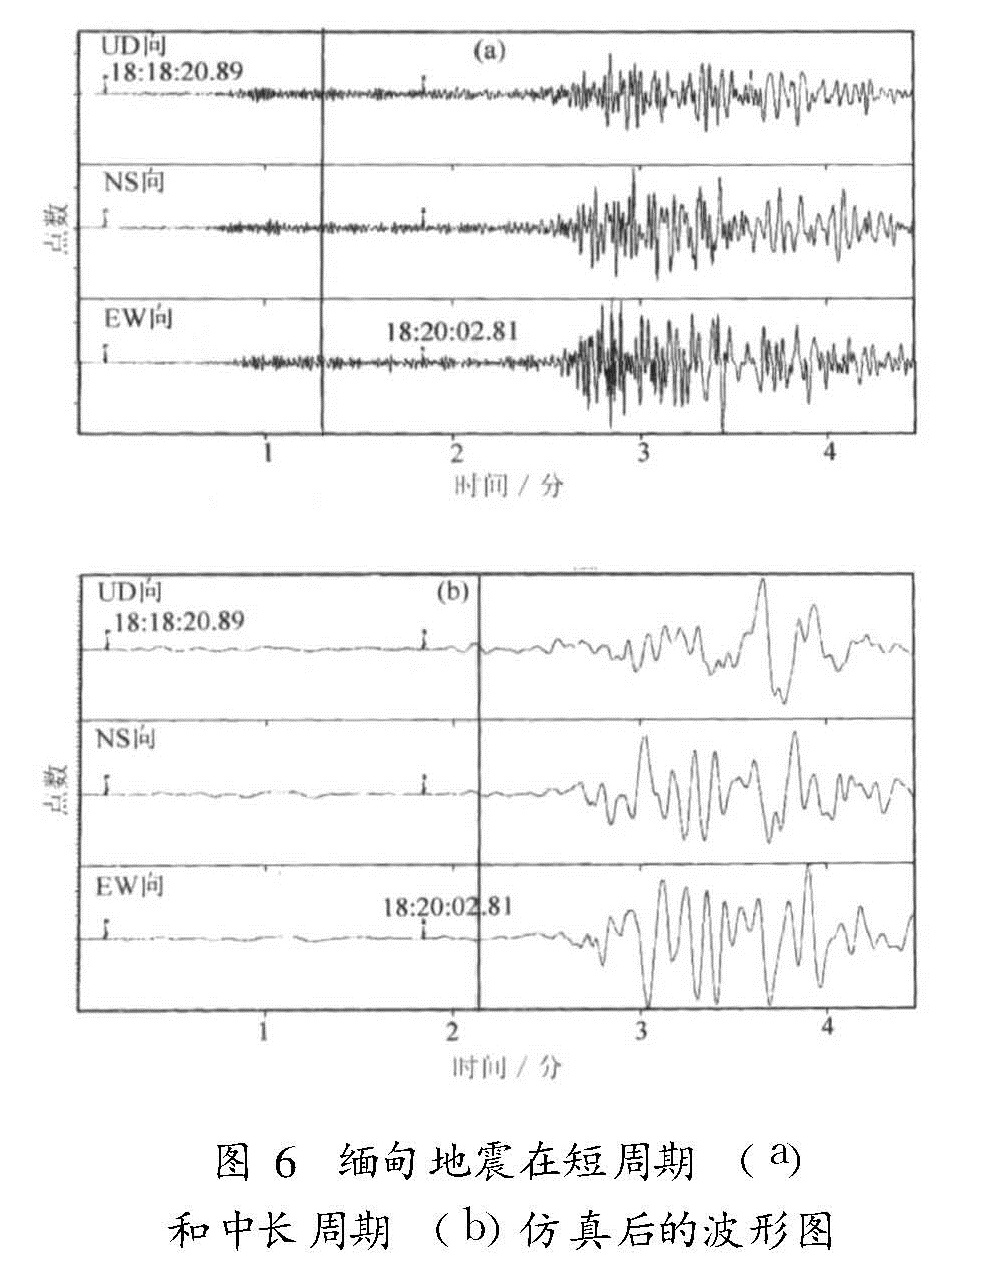
例5.缅甸地震
发震时刻:2003-09-21 18:16:12.2; 震中位置:19.8°N,95.2°E; 震级:7.2; 震中距:9.1°。
分析出P、S波后,由DIMAS软件自动计算出地震基本参数:Origin Time=2003.09.21 18:16:12.110; Depth=33 km; Distance=9.08°。此地震也是处在影区范围内,震中距为9.1°,P波较弱,是通过局部放大后确定的,所以从图6上看,P波不太明显,S波也不清楚,振幅较弱,但此处周期已稍变大。若在振幅稍变大之处确定S波,就晚了至少8 s。
图6 缅甸地震在短周期(a)和中长周期(b)仿真后的波形图