(埃及国家天文和地球物理研究所地震学室,埃及开罗市Helwan镇)
(Seismology Dept,National Research Institute of Astronomy and Geophysics,Helwan,Cairo,Egypt)
seismic refraction; seismic hazard; site response CLC number:P315.9 Document code:A Article ID:1000-0666(2008)02-0160-11
备注
根据埃及Gasco天然气公司工程场地的现场调查资料、地震活动性和地震灾害评估结果,对该场地进行了评估。通过浅源地震波折射勘探,对8个地震剖面上的土壤和岩石的弹性动态常数进行了分析。场地地面模型包括两层,分析表明它们具有从中值到高值的弹性动态常数,说明场地有良好的土壤条件和基岩岩性。同时,我们搜集和分析了研究区周围150 km半径范围内的历史和仪器记录地震,从构造环境、地震活动性、地质构造和主要地震的断层面解等方面进行了研究,认为场地受4个震源区的影响:苏伊士中部海湾、开罗—苏伊士地区、开罗西南和Beni-Suef地区。我们采用地震活动性统计方法并结合专家判定,确定了这些震源区内最大地震的矩震级(MW)。另外,依据场地峰值加速度(PGA)和反应谱,用随机方法对场地进行了地震灾害评估。4个震源区中,Beni-Suef地区距离工程场地最近,其PGA最大值为9.34 cm/s2,但这个值很小,表明地震不会对工程场地产生破坏性影响。最后,我们还模拟了阻尼为1%、3%和5%时的伪加速度场地反应谱。
:GASCO site has been evaluated on the basis of site investigation,seismic activity and seismic hazard assessment.Shallow seismic refraction survey has been carried out to estimate the elastic and dynamic constants for soil and rock materials throughout 8 seismic profiles.The ground model at the site consisting of two layers characterized by moderate to high values of elastic and dynamic constants indicates that the site has good soil and foundation rock.Both historical and instrumental earthquakes in a circle with radius of 150 km around the proposed site were collected and precisely analyzed.The site is affected by four seismic source zones:Central Gulf of Suez,Cairo-Suez District,Southwest Cairo and Beni-Suef,based on the tectonic setting,the seismicity,geological structures and fault plane solutions of major earthquakes.Maximum earthquake moment magnitudes(MW)have been identified for these source zones using seismicity statistics together with expert judgment.In addition,the stochastic approach was applied for the seismic hazard assessment in terms of Peak Ground Acceleration(PGA)and response spectra.It is noticed that Beni-Suef is the nearest source to the site and the maximum PGA value produced from this seismic source reaches 9.34 cm/s2.This value is small and reflects that there is no hazardous effect to be expected at GASCO site, which indicates its validity for civil engineering purposes.The response spectra at 1%,3%,5% and 10% damped Pseudo-acceleration(PSA)were also simulated at the GASCO site.
Introduction
The Egyptian company for Natural Gases(GASCO)selected a site in the eastern Desert of Egypt to construct an assembly for the natural gases.The estimation of dynamic characteristics for the subsurface ground structure and the seismic hazard assessment for this site became important and necessary.The shallow seismic refraction techniques are considered as one of the accurate and cost-effective methods used in engineering,archaeological,and environmental investigations①. Values of P- and S-wave velocities obtained from shallow seismic refraction surveys were used to determine the geotechnical properties for the foundation rock at GASCO site.The produced damage due to earthquake occurrences in different localities all over the world leads to the critical need for evaluation of earthquake activity and the seismic hazard assessment at the proposed sites for strategic projects.The stochastic simulation techniques proposed by Boore [2003] were used for the seismic hazard assessment in terms of Peak Ground Acceleration(PGA)and the response spectra.The prediction of ground motion or response amplitude as a function of earthquake magnitude and distance is of fundamental importance for the assessment of seismic hazard.
1 Geological and Structural Setting
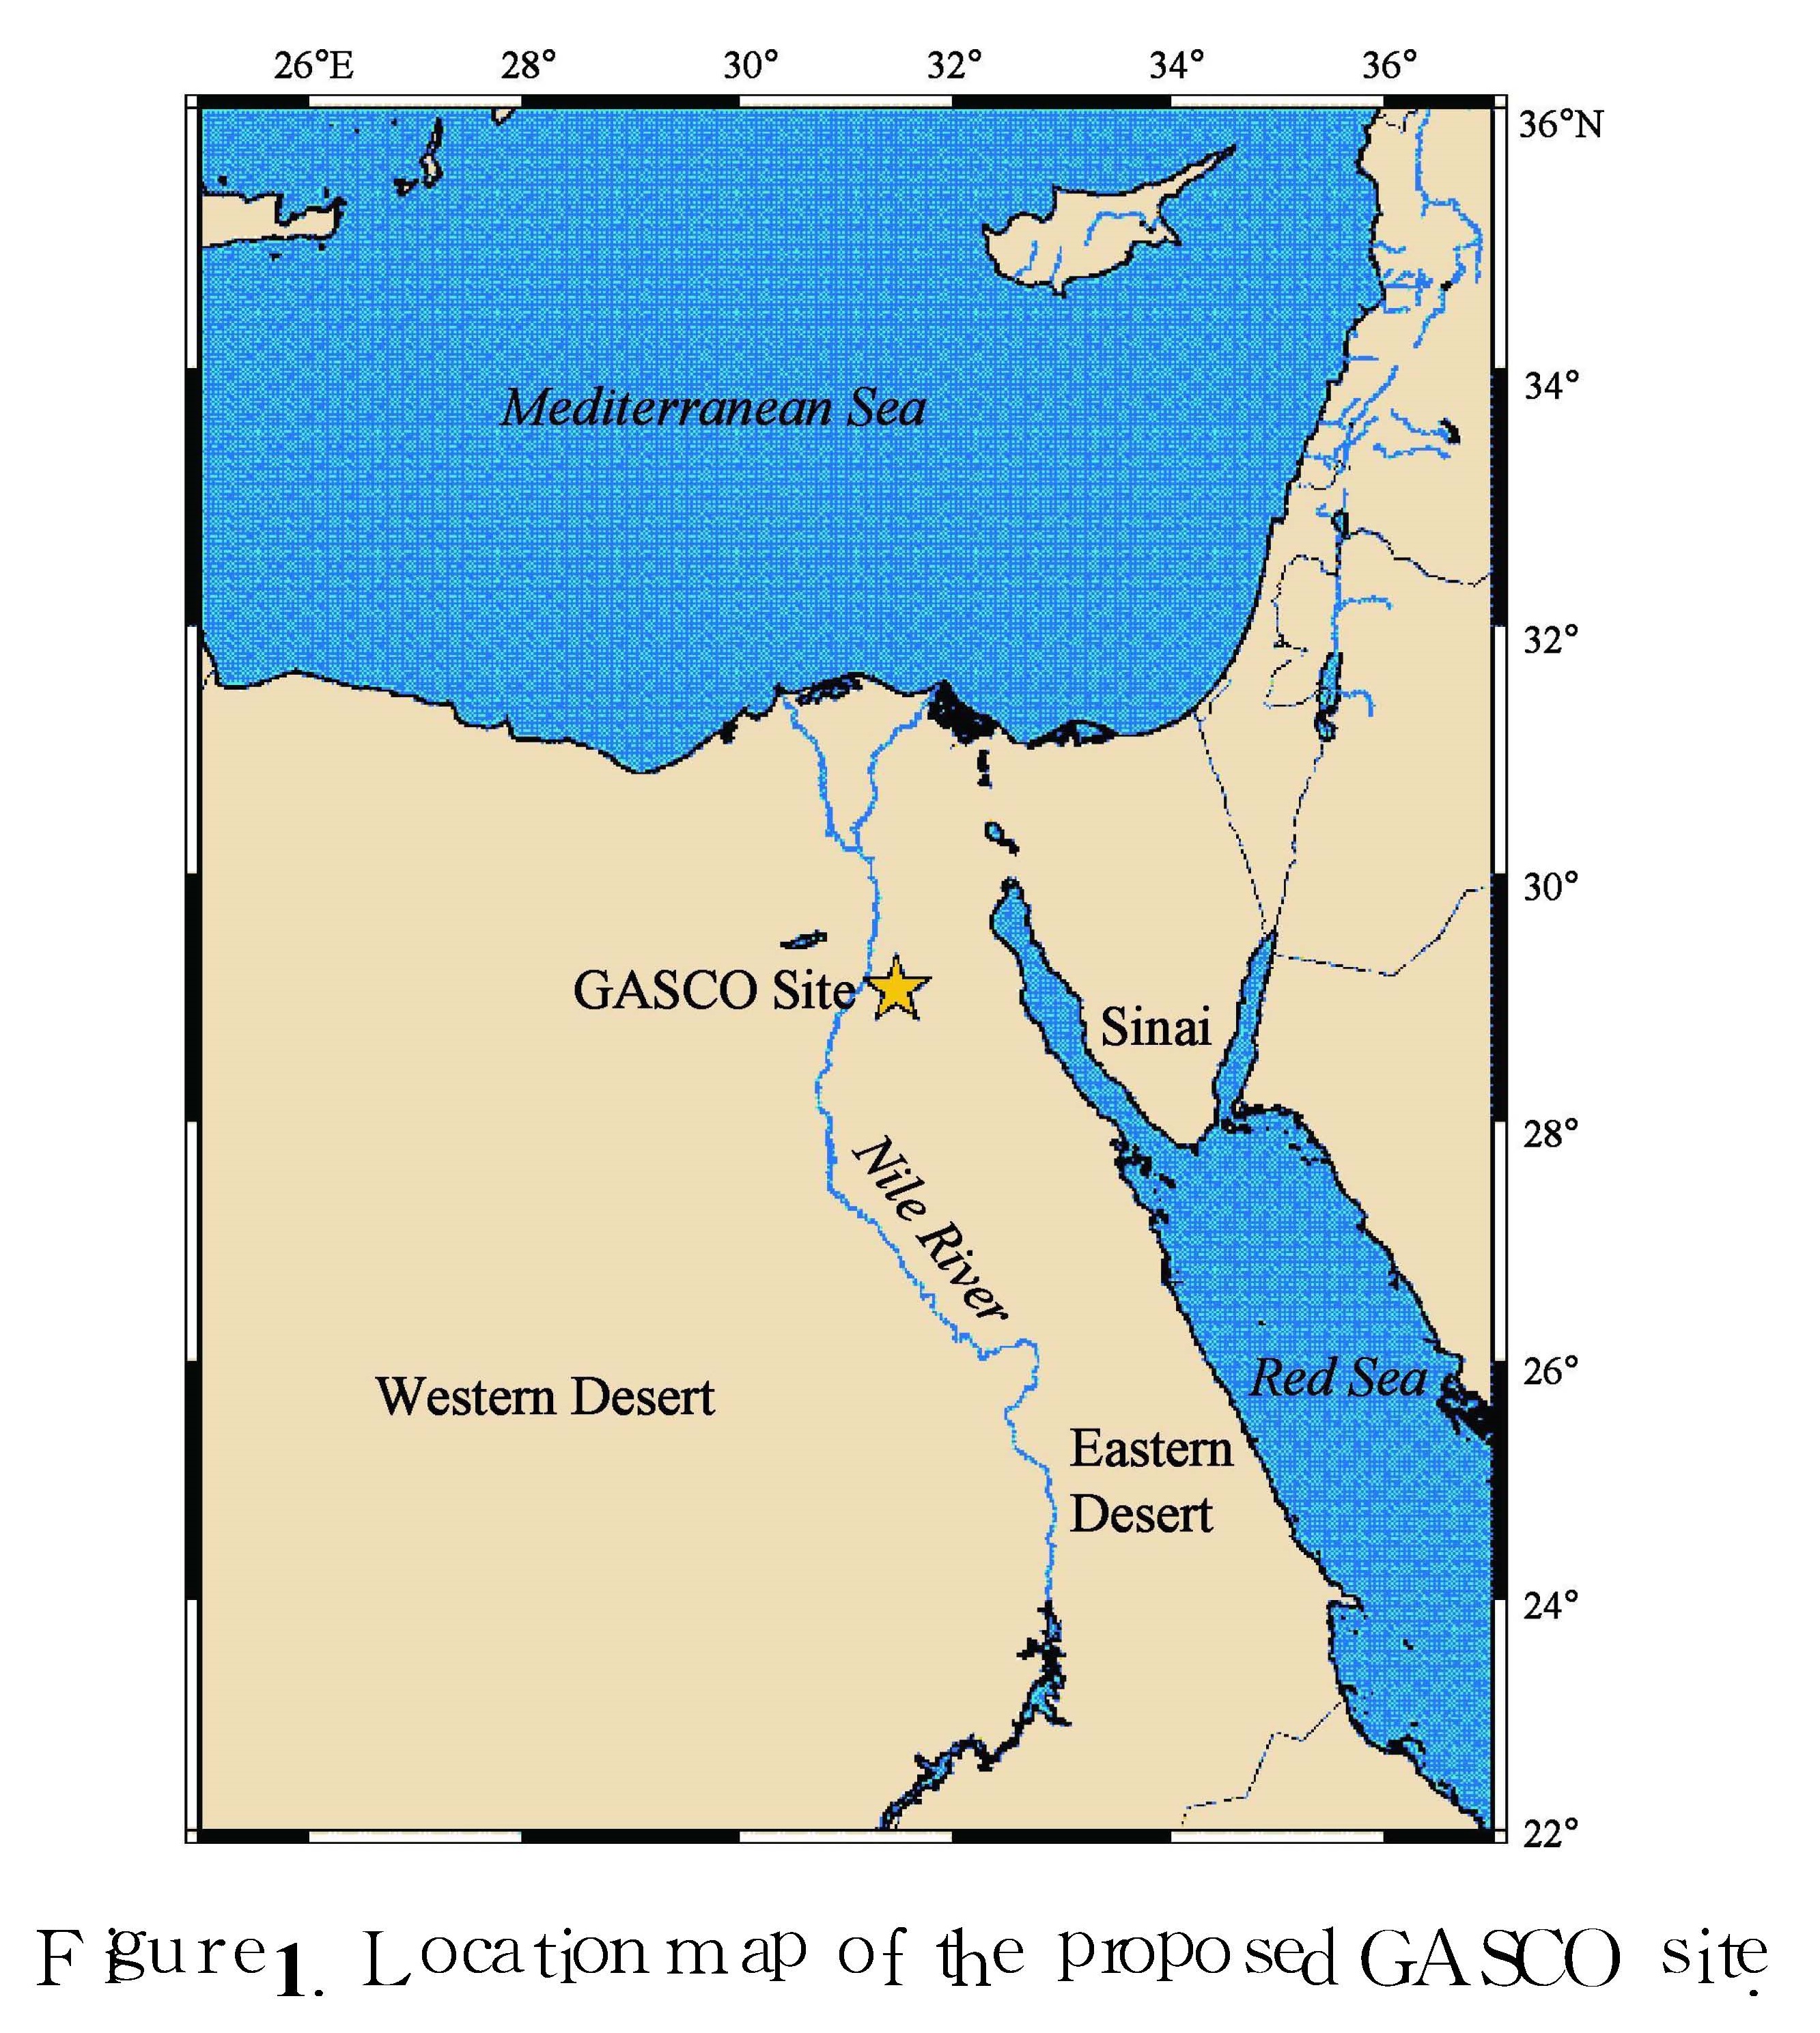
The proposed site is located in the northern part of the Eastern Desert about 38 km east of the Nile River,at 29°04'29″ N and 31°28'10″E(Figure 1).Topographically,the site represents a part from the Eastern Desert plateau where its elevation ranges from 333 m to 343 m above sea level.Geologically,the site is built mainly with Eocene limestone [Said,1990].Structurally,GASCO site is located in the stable shelf zone and there are no major structures encountered at surface of the selected site.
2 Geotechnical Evaluation of the GASCO Site
2.1 Seismic Refraction SurveySeismic refraction survey for 8 profiles was carried out at the site(Figure 2)using the 24-channel signal enhancement seismograph which was GEOMETRICS Strata View model.Each profile was 240 m long and the distance between two successive geophones was 10 m.The technique(for P-wave generation)is to shoot the profile at 10 m away from each end(normal and reverse shooting)and also from its mid-point for profiles No.1 to No.3.While from the profiles No.4 to No.8 the shooting was done behind each end with 10 m,at mid-point,at the distances of 65 m(between geophones No.6 and No.7)and 180 m(between geophones No.18 and No.19).The source of energy was the hydraulic weighting drop with a total mass weight of 100 kg.While the generation of shear waves(SH)was acquired using the horizontal geophones and a slotted striker plate by hitting one end of the plate horizontally using sledgehammer.
2.2 Data Analysis and ResultsThe seismic refraction data obtained from GASCO site was processed and analyzed using both SIP and SEISREFA programs which are complete seismic refraction processing and modeling software.The tra-vel time-distance curves and the corresponding 1-D(one-dimension)ground models were obtained(Figure 3).
The elastic properties and the material competence coefficients for the site are deduced(Table 1 and 2)for both surface and second layers.In the tables,the ultimate bearing capacity is indicated by Qult.
2.3 Elastic propertiesThe values for both P- and S-wave velocities are used to compute the elastic constants of the detected subsurface layers(Table 1 and 2).These constants include the density(ρ),stress ratio(Si),Poissons ratio(σ),rigidity modulus(μ),Youngs modulus(E)and Bulks modulus(B)as follows:
(1)Stress Ratio(Si)
The propagation of seismic waves is proportional to the differential pressure between the sedimentary overburden and the pore-filling fluids.This means that the high fluid pressure formations will have differential pressure and abnormally low seismic wave velocities.According to Abdel Rahman [1989] the stress ratio is given as:
Si=1-2(VS2 / VP2).(1)
The obtained values of the study area range from 0.349 to 0.397 in the surface layer(Figure 4a)and from 0.202 to 0.391 in the second layer(Figure 4b).These values of stress ratio reflect competent materials at the site.
(2)Poissons Ratio(σ)
This ratio represents the geometrical change in the shape of an elastic body.Its value is 0.5 for fluids and it approaches zero for very hard indurate rocks.Negative Poissons ratio is also recorded for very hard indurate anisotropic rocks.Poissons ratio(σ)is given in terms of P- and S-wave velocities [Abdel Rahman,1992]:
σ=[(VP/VS)2-2]/[(VP/VS)2-2].(2)
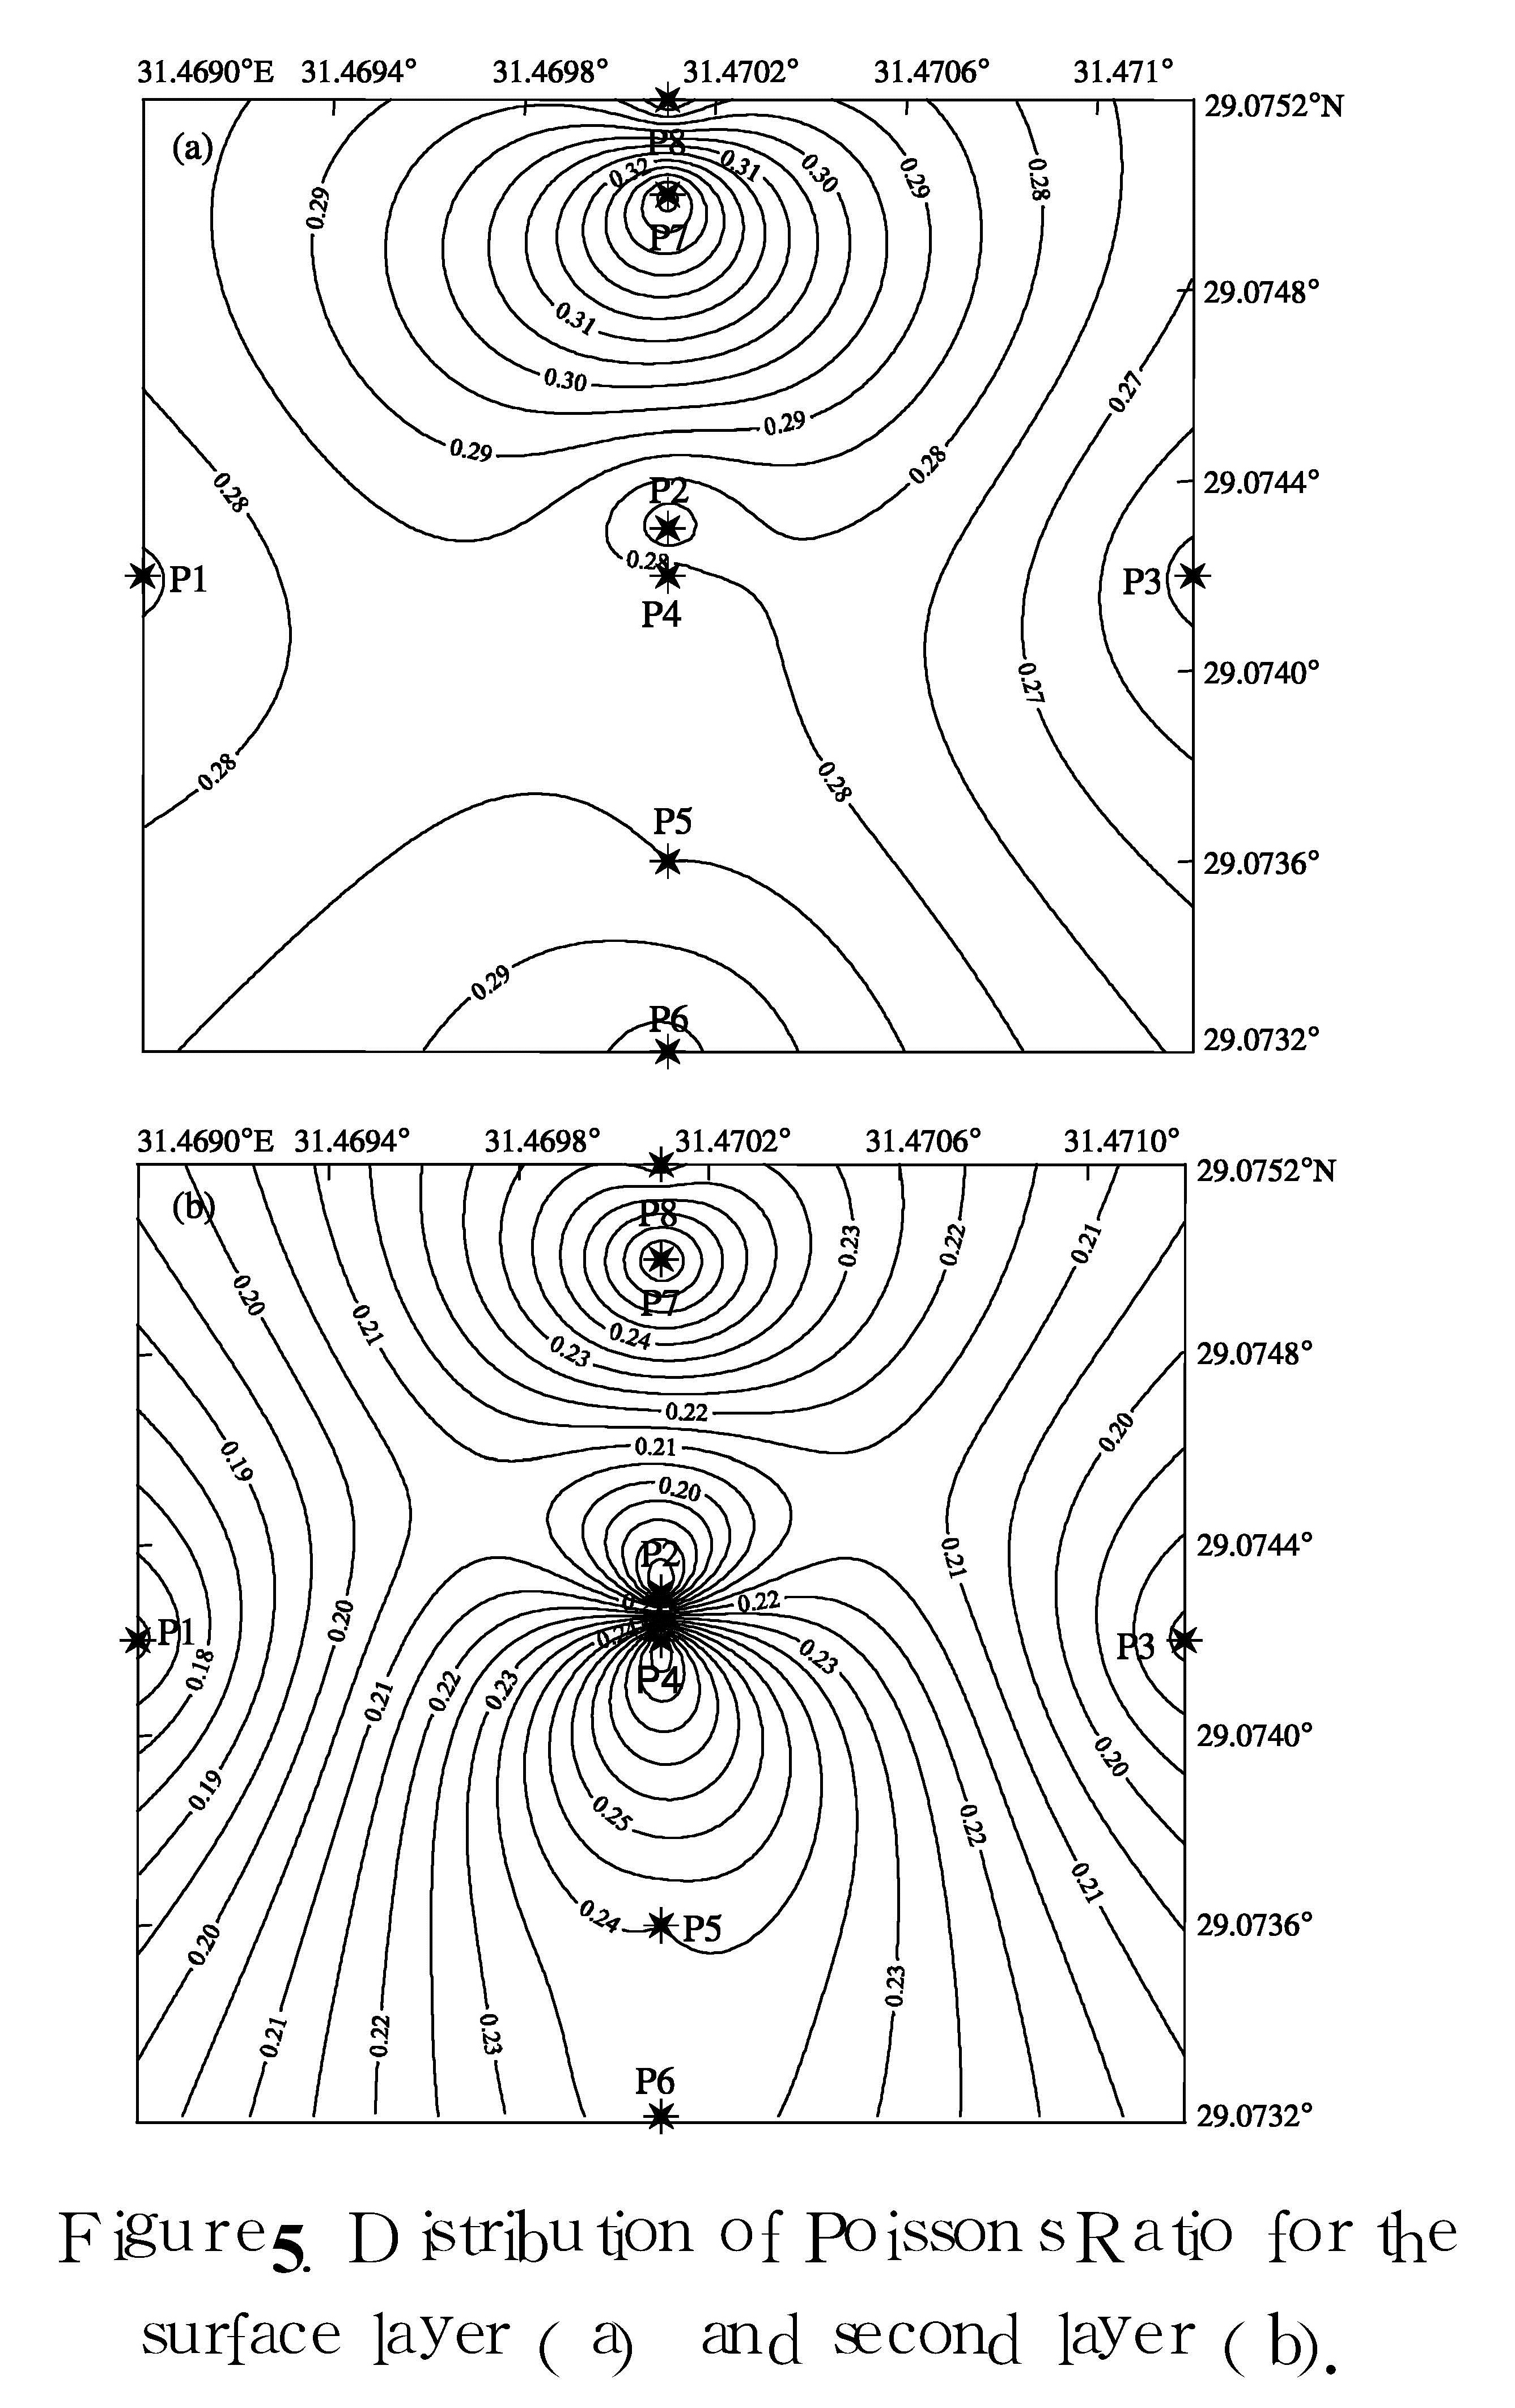
The values lie in the range from 0.258 to 0.344 in the surface layer(Figure 5a),and range from 0.168 to 0.281 in the second layer(Figure 5b),which indicate hard rocks.For the surface layer the area of profile No.3 is of the highest value.But the second layer reflects the area of profile No.1 is of the highest value.
2.4 Material Competence CoefficientsThere are a number of competence scales,based on the values of P-and S-wave velocities and elastic moduli in consequence,which are used to evaluate the soundness of rocks or soil materials,including the material index(Mi),concentration index(Ci),N-value and ultimate bearing capacity(Qult)as follows:
(1)Material Index(Mi)
Material index(Mi)is defined as the degree of competence of the material on the basis of the elastic moduli.This index must have relation with the material composition,the degree of consolidation,fracturing and jointing,the presence or absence of fluids in pore spaces which affect the elastic moduli.The material index is given [Abdel Rahman,1989] as follows:
Mi=(1-4σ).(3)
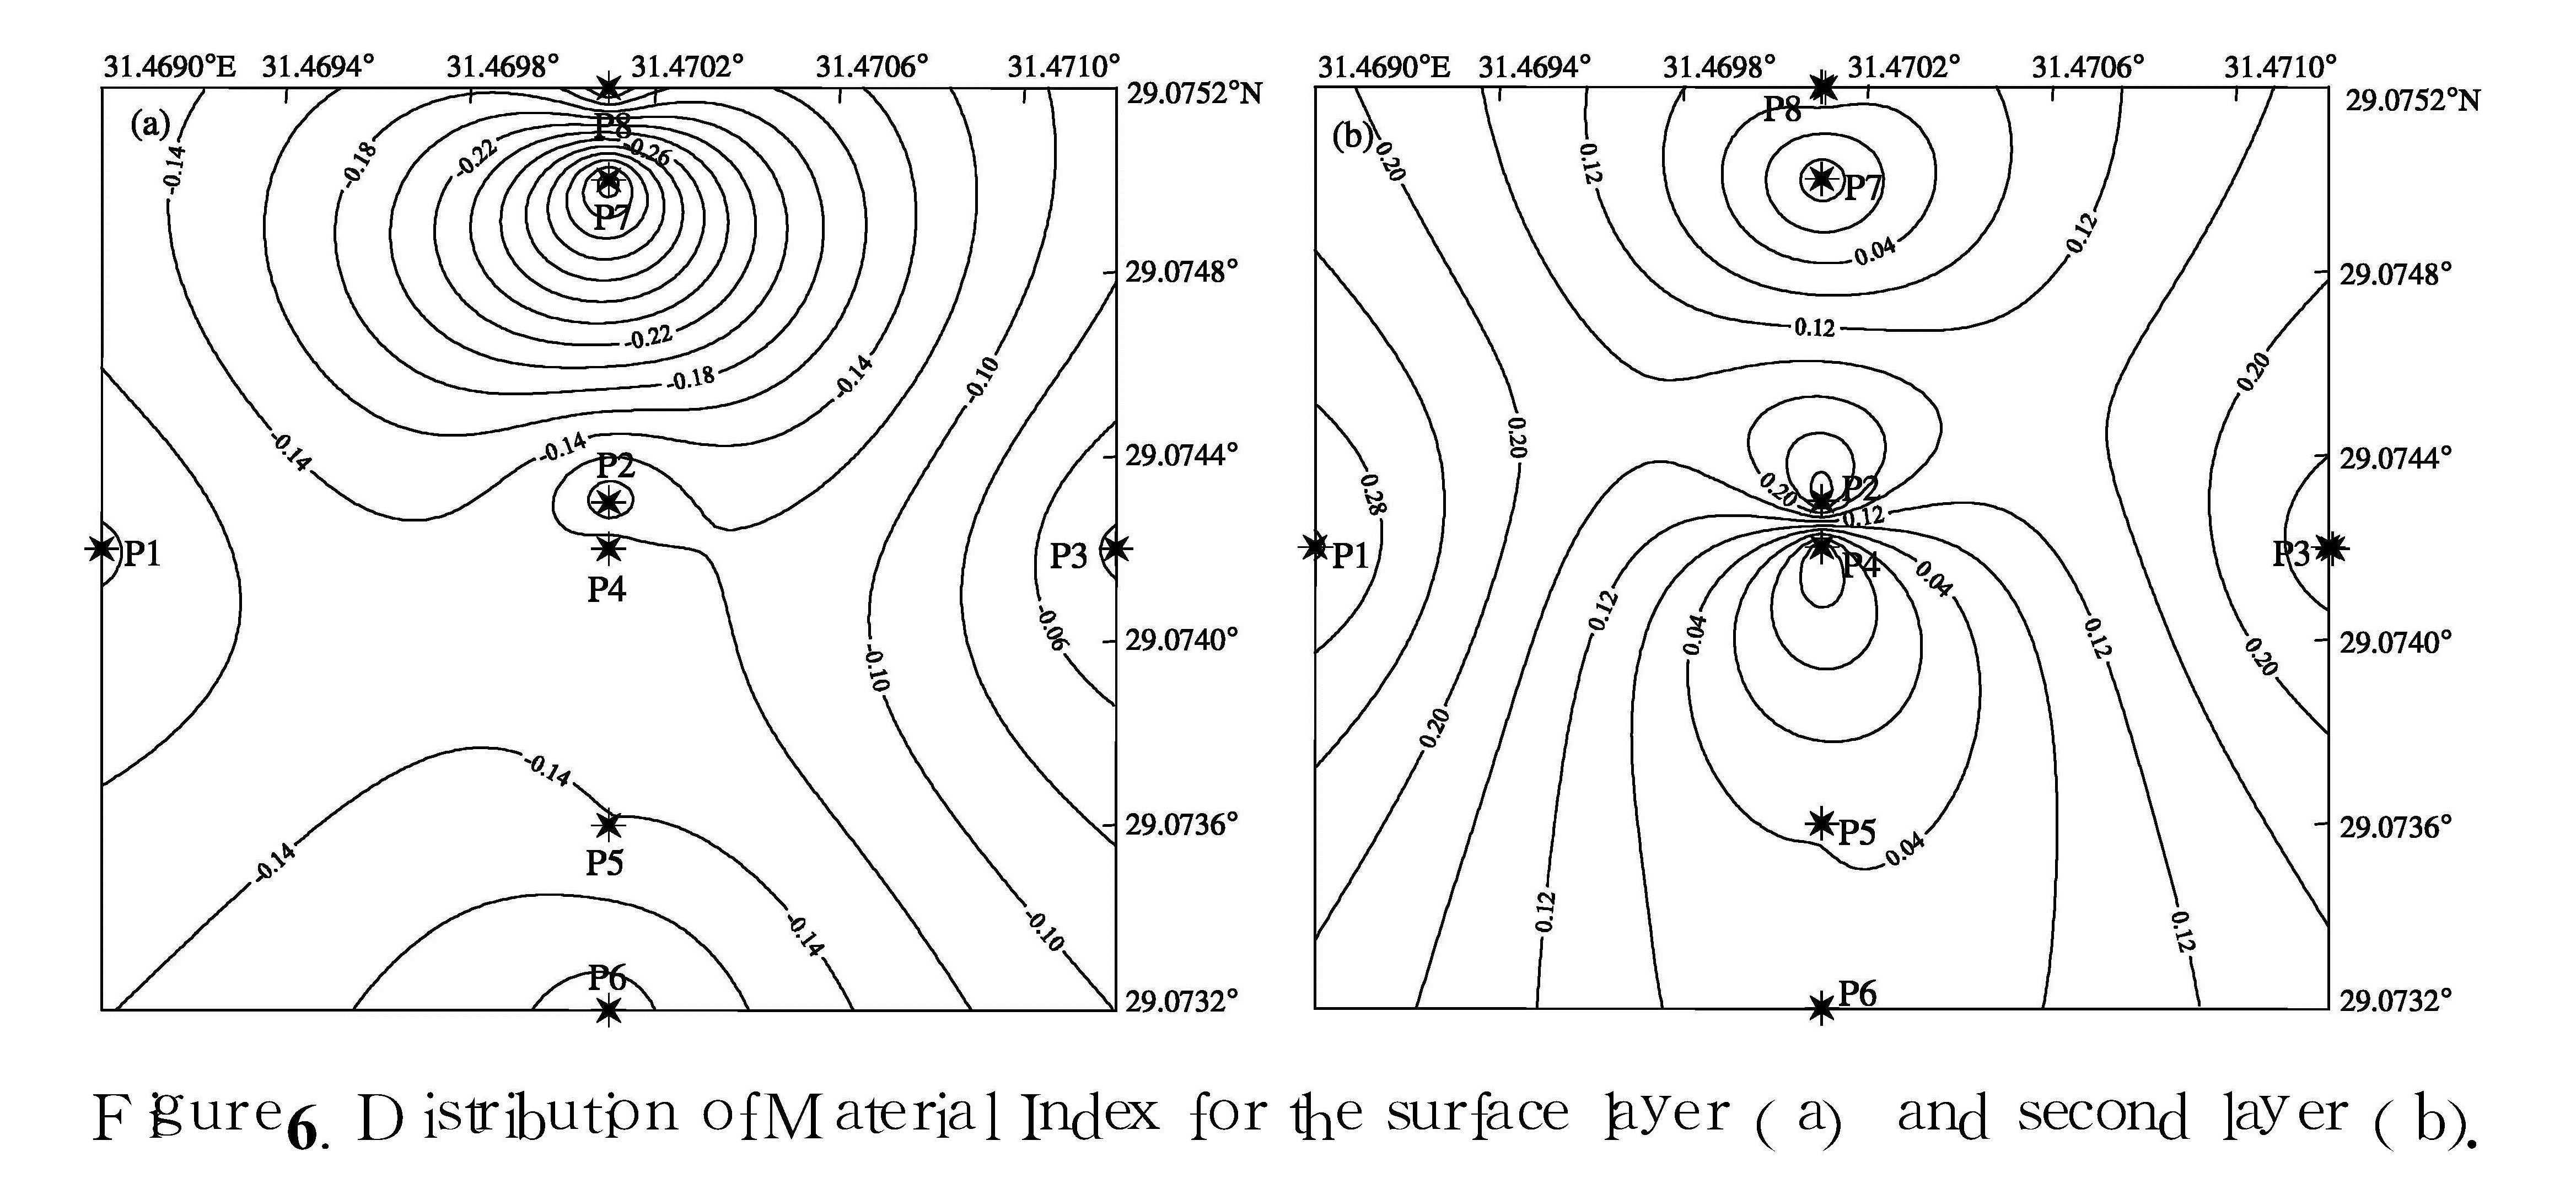
Where σ is the Poissons ratio.The values range between-0.377 and-0.035 in the surface layer(Figure 6a),while they range from-0.124 and 0.326 in the second layer(Figure 6b),and they indicate hard rocks.For the surface layer the area of Profile No.3 is of the highest value.But for the second layer the area of Profile No.1 is of the highest value.
(2)Concentration Index(Ci)
The concentration index(Ci)describes the degree of material concentration.The soil compaction status is considered,to a great extent,as a measure of the degree of competence for foundation and other civil engineering purposes.It depends on both elastic moduli of the soil and the pressure distribution at their
depth.The concentration index can be given in terms of velocity squared ratio [Abdel Rahman,1989] as:
Ci=(3-4 α)/(1-2 α).(4)
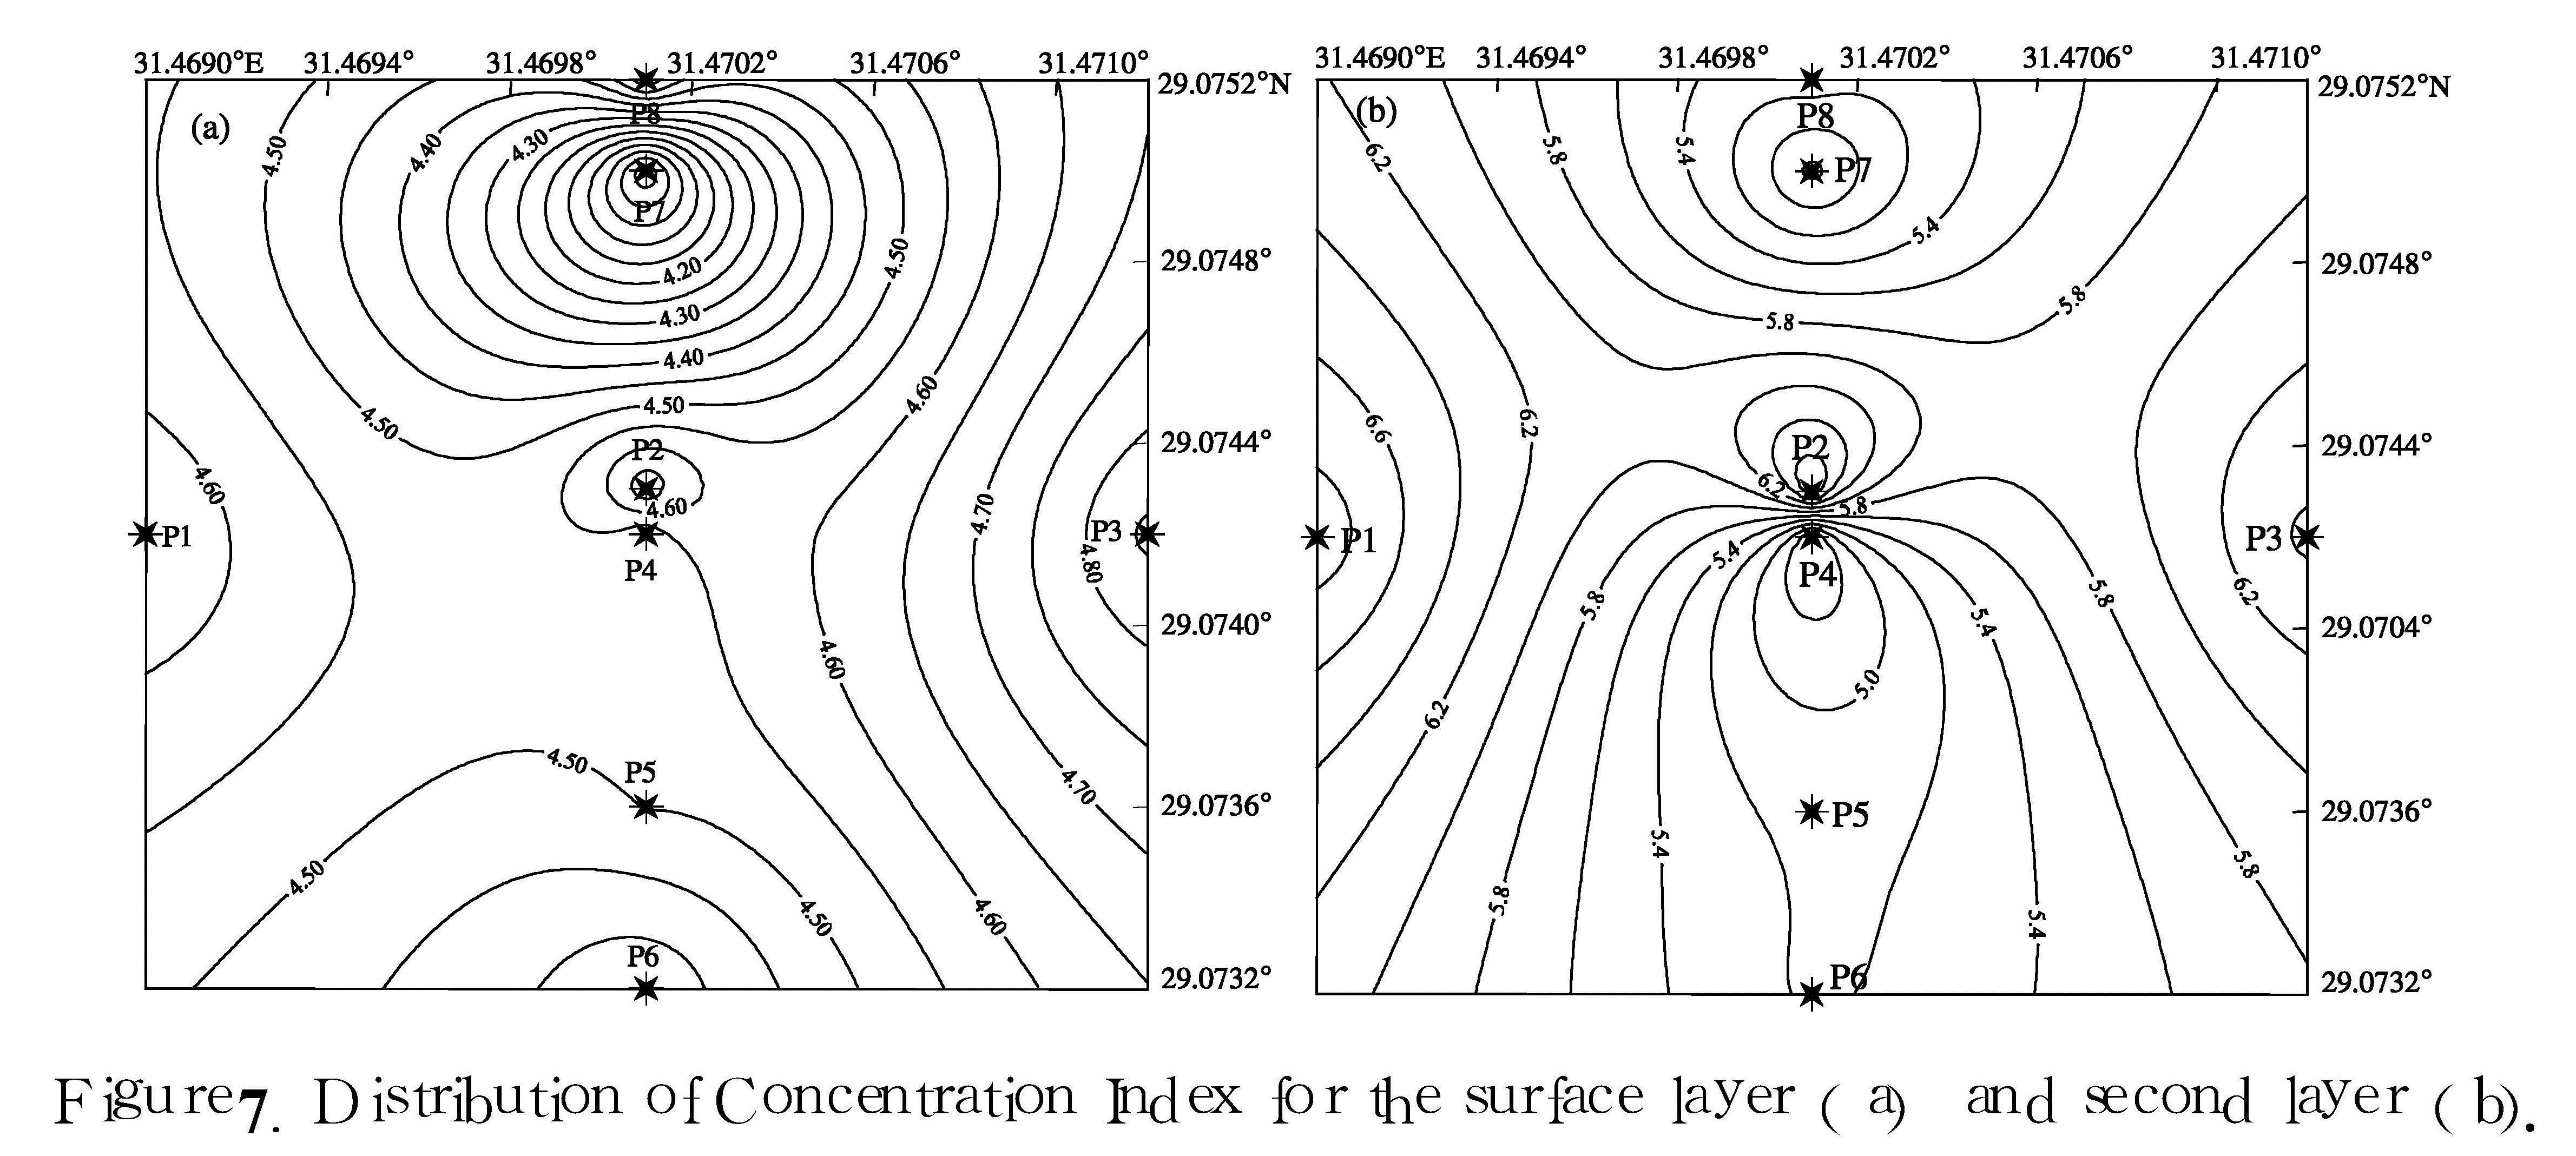
Where α is the velocity squared ratio(VS2/VP2).The obtained values in the surface layer ranges from 3.904 to 4.862(Figure 7a)and from 4.736 to
6.938 in the second layer(Figure 7b).This means that area of profile No.3 has the highest values for the surface layer,while the area of profile No.1 is of the highest values for the second layer.
(3)The N-value
This value is the resistance to penetration by normalized cylindrical bars under standard load,which is geophysically known as the Standard Penetration Test(SPT).N-value can be evaluated using the following formula [Imai et al.,1976; Stuempel et
al.,1984]:VS=89.9×N0.341.(5)
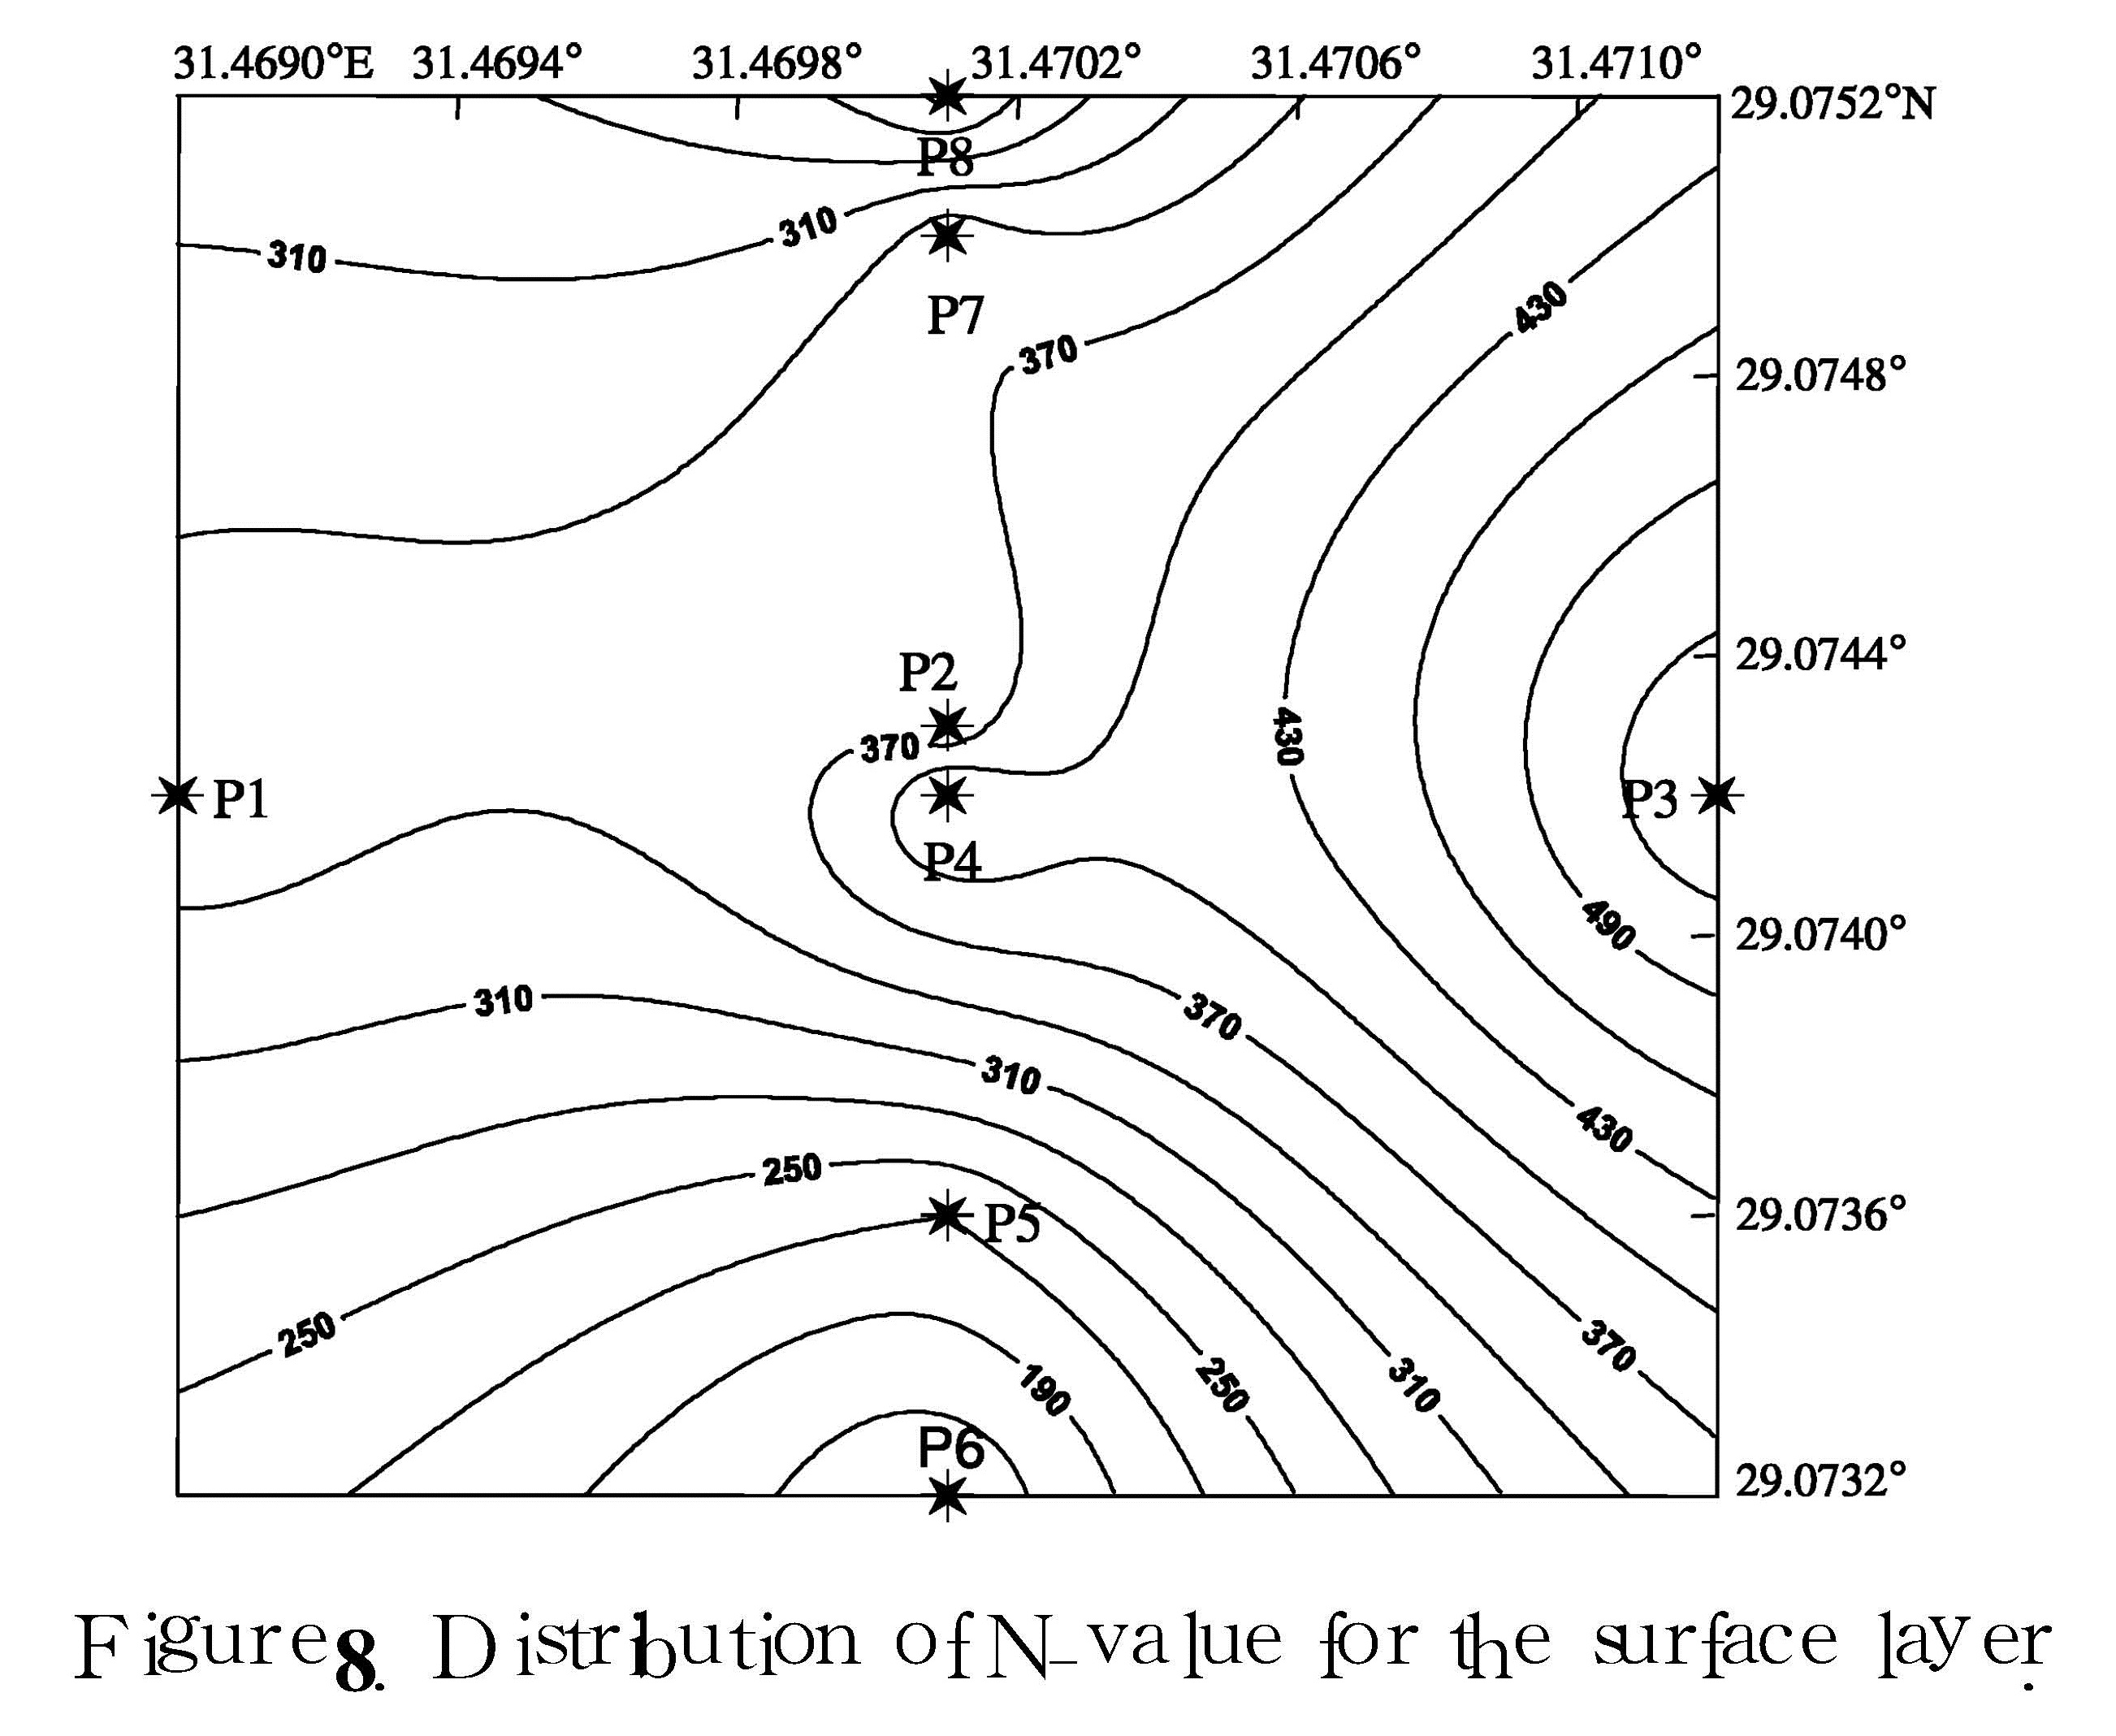
Where VS is the horizontal shear wave velocity.Material having low N-value indicates soft soil.The high values(between 133 and 551)in the surface layer(Figure 8)indicate a compacted soil at the site and hence there is no need to calculate the N-values for the second layer.
(4)Ultimate Bearing Capacity(Qult)
The natural and the artificial cyclic dynamic loading create additional load which is added to the building load and may cause soil liquefaction if the total loading value exceeds the ultimate bearing capacity(Qult)of the materialBowels J E.1984.Physical and geotechnical properties of soils.Mc Grew-Hill,London.. Qult can be given in terms of shear wave velocity [Abdel Rahman et al.,1992] as:
lgQult=2.932(lgVS - 1.45).(6)
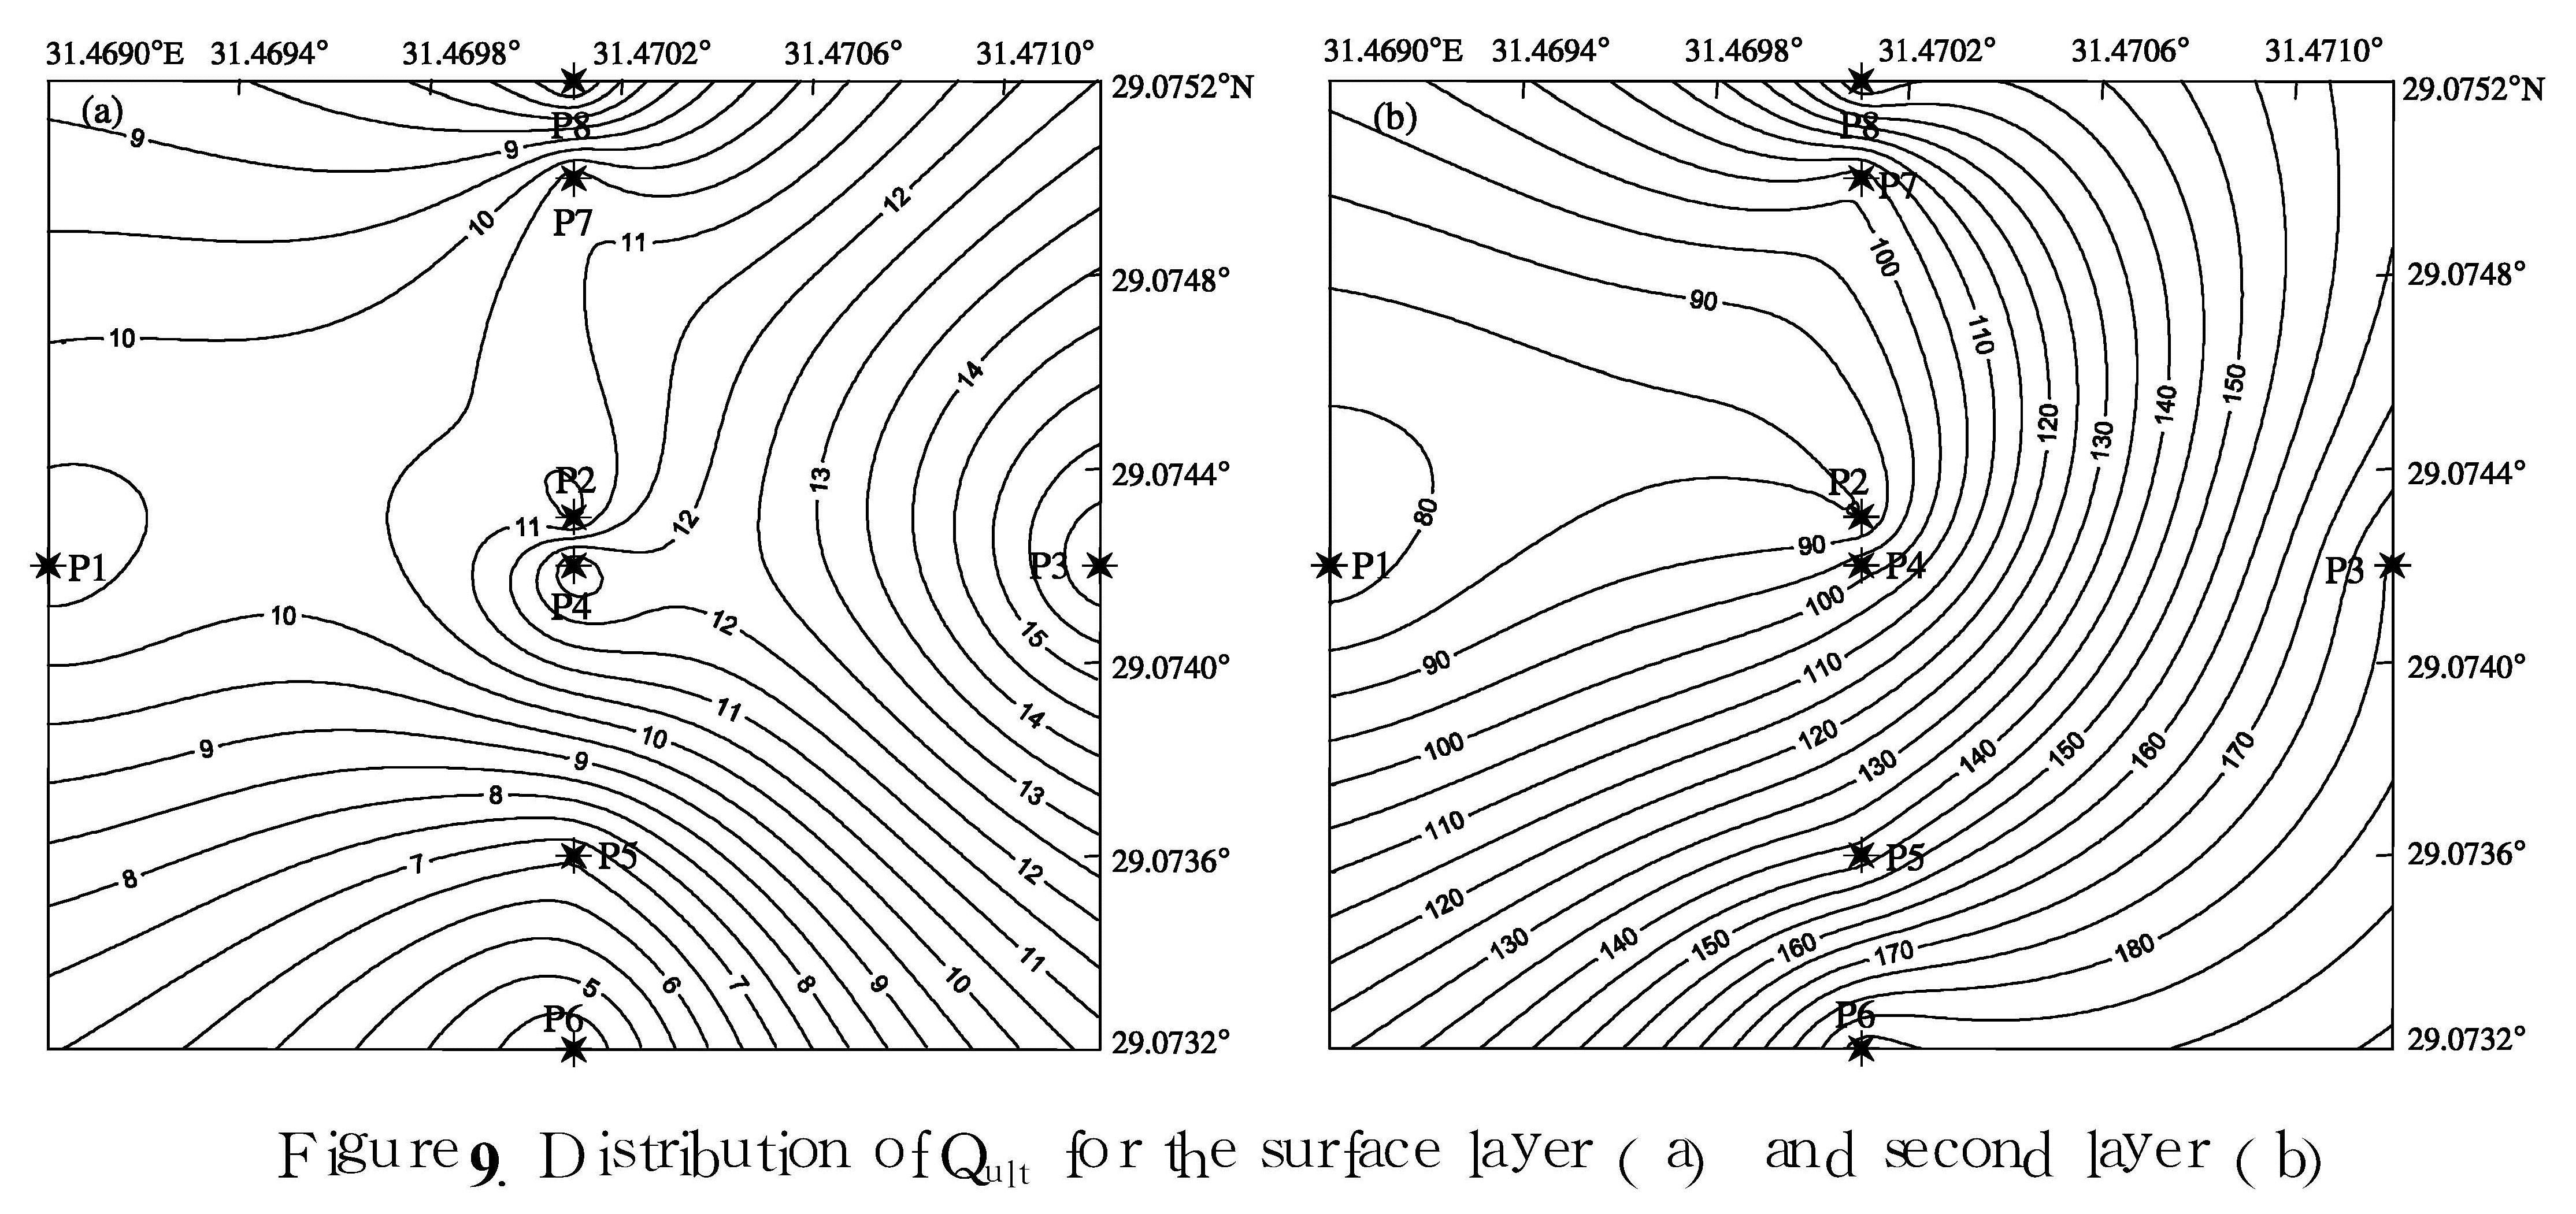
The obtained values range between 3.99 and 16.534 kg/cm2 in the surface layer(Figure 9a)and from 76.312 to 192.862 kg/cm2(Figure 9b)in the second layer.These values reflect that the area of profile No.3 is of the highest values for the surface and second layers.
3 Seismic Hazard Assessment for GASCO Site
4 Conclusions
Eight seismic profiles are carried out at GASCO site.It is noticed that the ground model consists of two layers.Both elastic moduli and material competence scales have been calculated and indicate that the site has a good soil and hard limestone rock.The seismic activity in a 150-km-radius circle has been collected from different data sources.Four seismic source zone which may affect GASCO site were identified and the maximum expected moment magnitudes were estimated for each seismic source zone.The stochastic technique was used for the simulation of the time history and response spectra for the PGA at GASCO site.Beni-Suef zone represents the nearest seismic source zone to GASCO site and the seismic moment of maximum earthquake that occurs from this source is found to be 2.82×1024 dyn·cm.The simulated PGA is about 9.34 Gal.Based on this study it can be concluded that,GASCO site is characterized by its low seismic activity and low values of PGA.In addition,the response spectra at GASCO site are calculated and available.This indicates that the selected site is valid and safe for construction purposes.
- Abd El Rahman M.1989.Evaluation of the kinetic moduli of the surface materials and application to engineering geologic maps at MaBarrisabah area(Dhamar province),Northern Yemen [J].Egypt.J.geol.,33(1-2):229-250.
- Abdel-Rahman M A, El-Etr H A.1978.The orientational characteristics of the structure grain of the Eastern Desert of Egypt [C]∥International Symp.on Evolution and Mineralization of the Arabian-Nubian Shield.Inst.Appl.Geol.Jeddah,S.A.
- Abd El Rahman,M Setto I and El-Werr A.1992.Inferring mechanical properties of the foundation materials at the 2nd Industrial zone[C]∥City geophysical measurements E.G.S.Proc.of the 10th Ann.Meet.50-61.
- Abu El-Enean K.1997.A study on the seismotectonics of Egypt in relation to the Mediterranean and Red Sea tectonics [D].Cairo:Ain Shams Univ.,Cairo.
- Abu El Enean K, Deif A.2003.Seismological Aspects and Source parameters of Beni-Suef earthquake on 11 October 1999 [J].Bull.Fac.of Sci.,Cairo Univ.,71:27-47.
- Ambraseys N N,Melville C P, Adams R D.1994.The seismicity of Egypt,Arabia and the Red Sea[G]∥A historical review.Cambridge:Cambridge Univ.Press:181.
- Atkinson G M, Boore D M.1995.Ground motion relations for eastern North America [J].BSSA,85(1):17-30.
- Boore D M.2003.Simulation of ground motion using the stochastic method [J].Pure and Applied Geophysics,160(3-4):635-676.
- Hanks T C, McGuire R K.1981.The character of high-frequency strong ground motion [J].BSSA,71(6):2071-2095.
- Hatzidimitriou P M,Papadimitrio E E, Mountrakis D M,et al.1985.The Seismic Parameter b of the frequency-magnitude relation and its association with the geologic zones in the area of Greece [J].Tectonophysics,120:141-151.
- Imai T,Fumoto H, Yokota K.1976.P- and S-wave velocities in subsurface layer of ground in Japan[R].Tokyo:Urawa Research Institute,Tokyo.
- Jennings P C.1983.Engineering seismology[C]∥Kanamori H, Boschi E.Proceedings of the International School of Physics“Enrico Fermi”.Course LXXXV,138-173.
- Maamoun M,Megahed A, Allam A.1984.Seismicity of Egypt[J].Bull.HIAG,IV(Ser.B):109-160.
- Meshref W M.1982.Regional structural setting of northern Egypt[C]∥6th Explor.Seminar,Egyptian General Petroleum Corporation.Cairo,Egypt:22.
- Moustafa S.2002.Assessment of ground motion variation for seismic hazard mitigation in the vicinity of Cairo metropolitan area[D].Ain Shams Univ.
- Mountrakis D,Sapountzis E, Kilias A,et al.1983. Paleogeographic conditions in the western Pelagonian margin in Greece during the intial rifting of the continental area[J].Can.J.Earth.Sci.,20:1673-1681.
- Mousa H M.1989.Earthquake activities in Egypt and adjacent regions and its relation to geotectonic features in A.R.Egypt[D].Mansoura University.
- Papazachos B C.1980.Seismicity rates and long-term earthquake prediction in the Agean area[J].Quaterniones Geodaesiae,3:171-190.
- Papazachos B C,Kiratzi A A, Hatzidimitriou P M.1984.Seismic faults in the Agean area[J].Tectonophysics,106:71-85.
- Papazachos B C,Scordilis E M, Panagiotopoulos D G,et al. 2004. Global relations between seismic fault parameters and moment magnitude of Earthquakes[J].Bull.Geol.Soc. Greece,XXXVI:1482-1489.
- Reiter L.1991.Earthquakes hazard analysis[M].New York:Colombia Univ.Press.
- Said R.1990.Geology of Egypt [M].Amesterdam:Elsevier Publication.
- Stumpel H,Käehler S,Meissner R,et al.1984.The use of seismic shear waves and compressional waves for lithological problems of shallow sediments[J].Geophysical Prospecting,32:662-675.
3.1 Earthquake ActivityThe available earthquake data around GASCO site contain two types of information:historical observations(pre-1900)of major seismic events that occurred over a period of about 4000 years and instrumental earthquakes(1900-July 1997)that collected from Maamoun et al.[1984],Ambraseys et al.[1994] and International Seismological Center(ISC).Data from Aug.1997 till Dec.2004 were gathered from the Bulletins of the Egyptian National Seismological Network(ENSN).From the distribution of the earthquake activity around the GASCO site(Figure 10)it is noticed that,GASCO site is located in the mainland of the eastern desert and surrounded by the earthquakes with magnitude ranging from less than 3 to greater than 5.
3.2 Seismic Source ZonesThe definition of seismic zones carried out in the present work depends on historical and instrumental earthquakes as well as the results of the previous geophysical and geological studies including the kind of seismic faulting [Papazachos et al.,1984],seismicity rate(a-value)[Papazachos,1980],b values [Hatzidimitriou et al.,1985],major trends of geological zones [Mountrakis et al.,1983],and the fault plane solutions of the major earthquakes(i.e.strike,dip and stress axes).A seismic zone is a configuration within which it is assumed that an earthquake recurrence process is considered to be spatially and temporally homogeneous.The delineation of the seismotectonic sources usually represents the major part of any seismic hazard analysis.According to this study,the seismic activities are concentrated in 4 seismic zones as follows:Central Gulf of Suez zone; Cairo-Suez District zone; Southwest Cairo zone; Beni-Suef zone.
3.2.1 Central Gulf of Suez zoneFault plane solutions show the mixing between the earthquakes occurred on the marginal faults and those occurred on the transverse ones.Also,some of them are nearly of a pure normal faulting,while the others have a considerable strike-slip component [Maamoun et al.,1984].
The central Gulf of Suez zone has a regional northeast dip and bounded from north and south by 2 major accommodation zones of relatively flatter dip separating it from both the northern and southern provinces.Geophysical and geological observations confirm this model.The seismic activity in the central provinces is low compared with both the southern and northern provinces.This becomes clear after the establishment of ENSN.
3.2.2 Cairo-Suez District zoneIt is located in the northeastern Desert and extends from Cairo to Suez at the north of the Gulf of Suez.It is characterized by small to moderate earthquakes.The Cairo-Suez district is affected by 3 fault trends.One of them is the EW trend,mostly pronounced and almost aligned by latitude 30°N,where the other 2 trends(ENE and NW)are spatially more dispersed [Abdel-Rahman et al.,1978].The focal mechanism for the 1974 Abu-Hammed earthquakeHassib G H.1990.A study of focal mechanism for recent earthquakes in Egypt and their tectonic implication.Egypt:Fac.of Sci.,Assiut Univ.,Egypt.[Mousa,1989] shows two planes trending ENE-WSW and NNW-SSE with left-lateral strike-slip motion along the second plane.The focal mechanism of 1984 Wadi-Hagul earthquake shows the same strike-slip with reverse component.In addition,the mechanism of the 1987 Ismailiya earthquake shows strike-slip also with two nodal planes trending N 68°E and S 24°E with steep dip angles(80° and 80°)Megahed A., Dessoky M M.1988.The Ismailia(Egypt)earthquake of January 2nd,1987(Location,Macroseismic Survey,Radiation pattern of first motion and its tectonic implications)..
3.2.3 Southwest Cairo zoneThis zone was defined depending on the epicentral distribution,seismicity level,and the a-value which is determined for this zone(a=3.07).The focal mechanisms of some earthquakes in this zone show a normal faulting only or a normal faulting with large strike-slip component [Abu El-Enean,1997].The first nodal plane is trending nearly E-W(WNW-ESE)parallel to the Mediterranean trend.This shows the coincidence with the surface lineaments,as appeared directly after the occurrence of the 1992 earthquake and the general tectonics of the area.Therefore,this plane is recommended to be the most probable fault plane.The auxiliary plane is trending mainly NW-SE parallel to the Gulf of Suez.No NE-SW trend parallel to the Pelusium trend is given by the focal mechanisms.
3.2.4 Beni-Suef zoneBeni-Suef zone is located to the east of the Nile Valley.Meshref [1982] indicated that the basic tectonic trends affecting northeast Africa are WNW and ENE.Halsay Halsay J.1975.Interpretation of ERTS linears.Cairo:Cairo University. considered the N 60°W trend is the significant trend in northern Egypt.This zone has a tentative trend parallel to the Red Sea trend from the distribution of earthquake epicenters.The parameter a-value is 1.49.The focal mechanism for Beni Suef earthquake on 11 October 1999 indicates a normal faulting mechanism with minor horizontal movement with trends NW-SE and ENE-WSW [Abu El Enean at al,2003].
3.2.5 Maximum Earthquake MagnitudeThis step requires a determination of the maximum earthquake for each of the identified seismotectonic sources.In deterministic analysis,it is more common to define the maximum earthquake as a maximum credible earthquake [Reiter,1991].Another kind of maximum earthquake is the maximum historic earthquake with increasing 0.5 units.There are 4 seismic source zones affecting the site and each of them has its own seismic activity.
The earthquake activity in terms of focal depth and horizontal axes together with the later activity are used to determine the dimensions of the active seismic source area [Abu-Elenean,1997].The epicentral distribution of the seismic activity of the southwest Cairo seismic zone indicates that the maximum dimension of the activity is 41 km and the depth ranges from 7 to 25 km yielding a thickness of a seismogenic layer of 18 km.Thus the total seismogenic area of this zone is 738 km2.According to Papazachos et al.[2004],the maximum earthquake of this zone is found to be with moment magnitude 6.31.
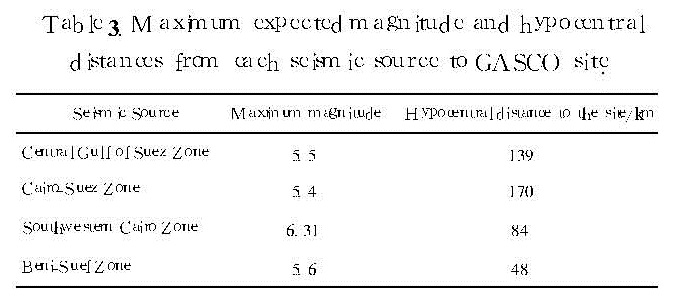
Using the same techniques for the central Gulf of Suez,the expected maximum earthquakes are determined,while the historical approach was used for the other seismic sources(Table 3).
Table 3.Maximum expected magnitude and hypocentral distances from each seismic source to GASCO site.Seismic Source Maximum magnitude Hypocentral distance to the site/kmCentral Gulf of Suez Zone 5.5 139Cairo-Suez Zone 5.4 170Southwestern Cairo Zone 6.31 84Beni-Suef Zone 5.6 48
3.3 Simulation of Ground Motion at GASCO Site Using Stochastic Method 3.3.1 Input Parameters(1)The source parameters [E(M0,f)]
The earthquake source spectrum E(M0,f)for the horizontal component of ground motion is given by the following:
E(M0,f)=C(2πf)2M0S(M0,f).(7)
where S(M0,f)is the displacement source spectrum and C is a constant.C=RSVF/(4πρβ3R),with R=1 km,RS=0.55(average shear wave radiation pattern),F=2.0(free surface effect),V=0.71(partition onto two horizontal components),ρ is the density at the source and β is the shear wave velocity at the source.
(2)The path [P(R,f),duration]
In this study,the three-segment-geometrical-spreading operator of Atkinson et al. [1995] is used.Geometrical spreading R-1 is assumed for distance less than 70 km and R0.0 for distances from 70 km to 130 km and R-0.5 for greater distances.The Q model derived by Moustafa [2002] is used to represent the anelastic attenuation factor.This model is represented as:
Q=85.68f 0.79.(8)
Although the Fourier spectrum of ground motion is not dependent on the duration,duration is a very important parameter for peak motions decrease with increasing duration.The duration is a function of the path,as well as the source:
T=T0 + bR.(9)
Where T0 is the source duration and bR represents the path dependent term that accounts for dispersion.Following Hanks et al. [1981],the source duration is related to the corner frequency by
T0=f-1c.(10)
Empirical observations and theoretical simulations suggest that the path-dependent part of the duration can be represented by a connected series of straight-line segments with different slopes.The function of Atkinson et al. [1995] is used where the path duration is modeled as trilinear,using the transition distances 70 and 130 km for consistency with the attenuation model.The slope is 0.16 for the distance ranges between 10 and 70 km,-0.03 for the distance ranges between 70 and 130 km and 0.04 for the distance ranges from 130 to 1000 km.The slope is assumed to be zero for the distances less than 10 km.
(3)The site G(f)
The factors that control the change of the seismic ground motion amplitudes at the earths surface are impedance and diminution.Boore [2003] separated the path effect G(f)into two terms as follows:
G(f)=A(f)+ D(f).(11)
Velocity and density model is converted into site amplification A(f),using the square root of the impedance ratio between the source and the surface.For polarized shear waves,the impedance is defined as the product of the shear wave velocity,density and the cosine of the angle of incidence.The amplification is relative to the surface motion that would exist if the material were replaced with uniform material whose velocity and density equal to those at the source.
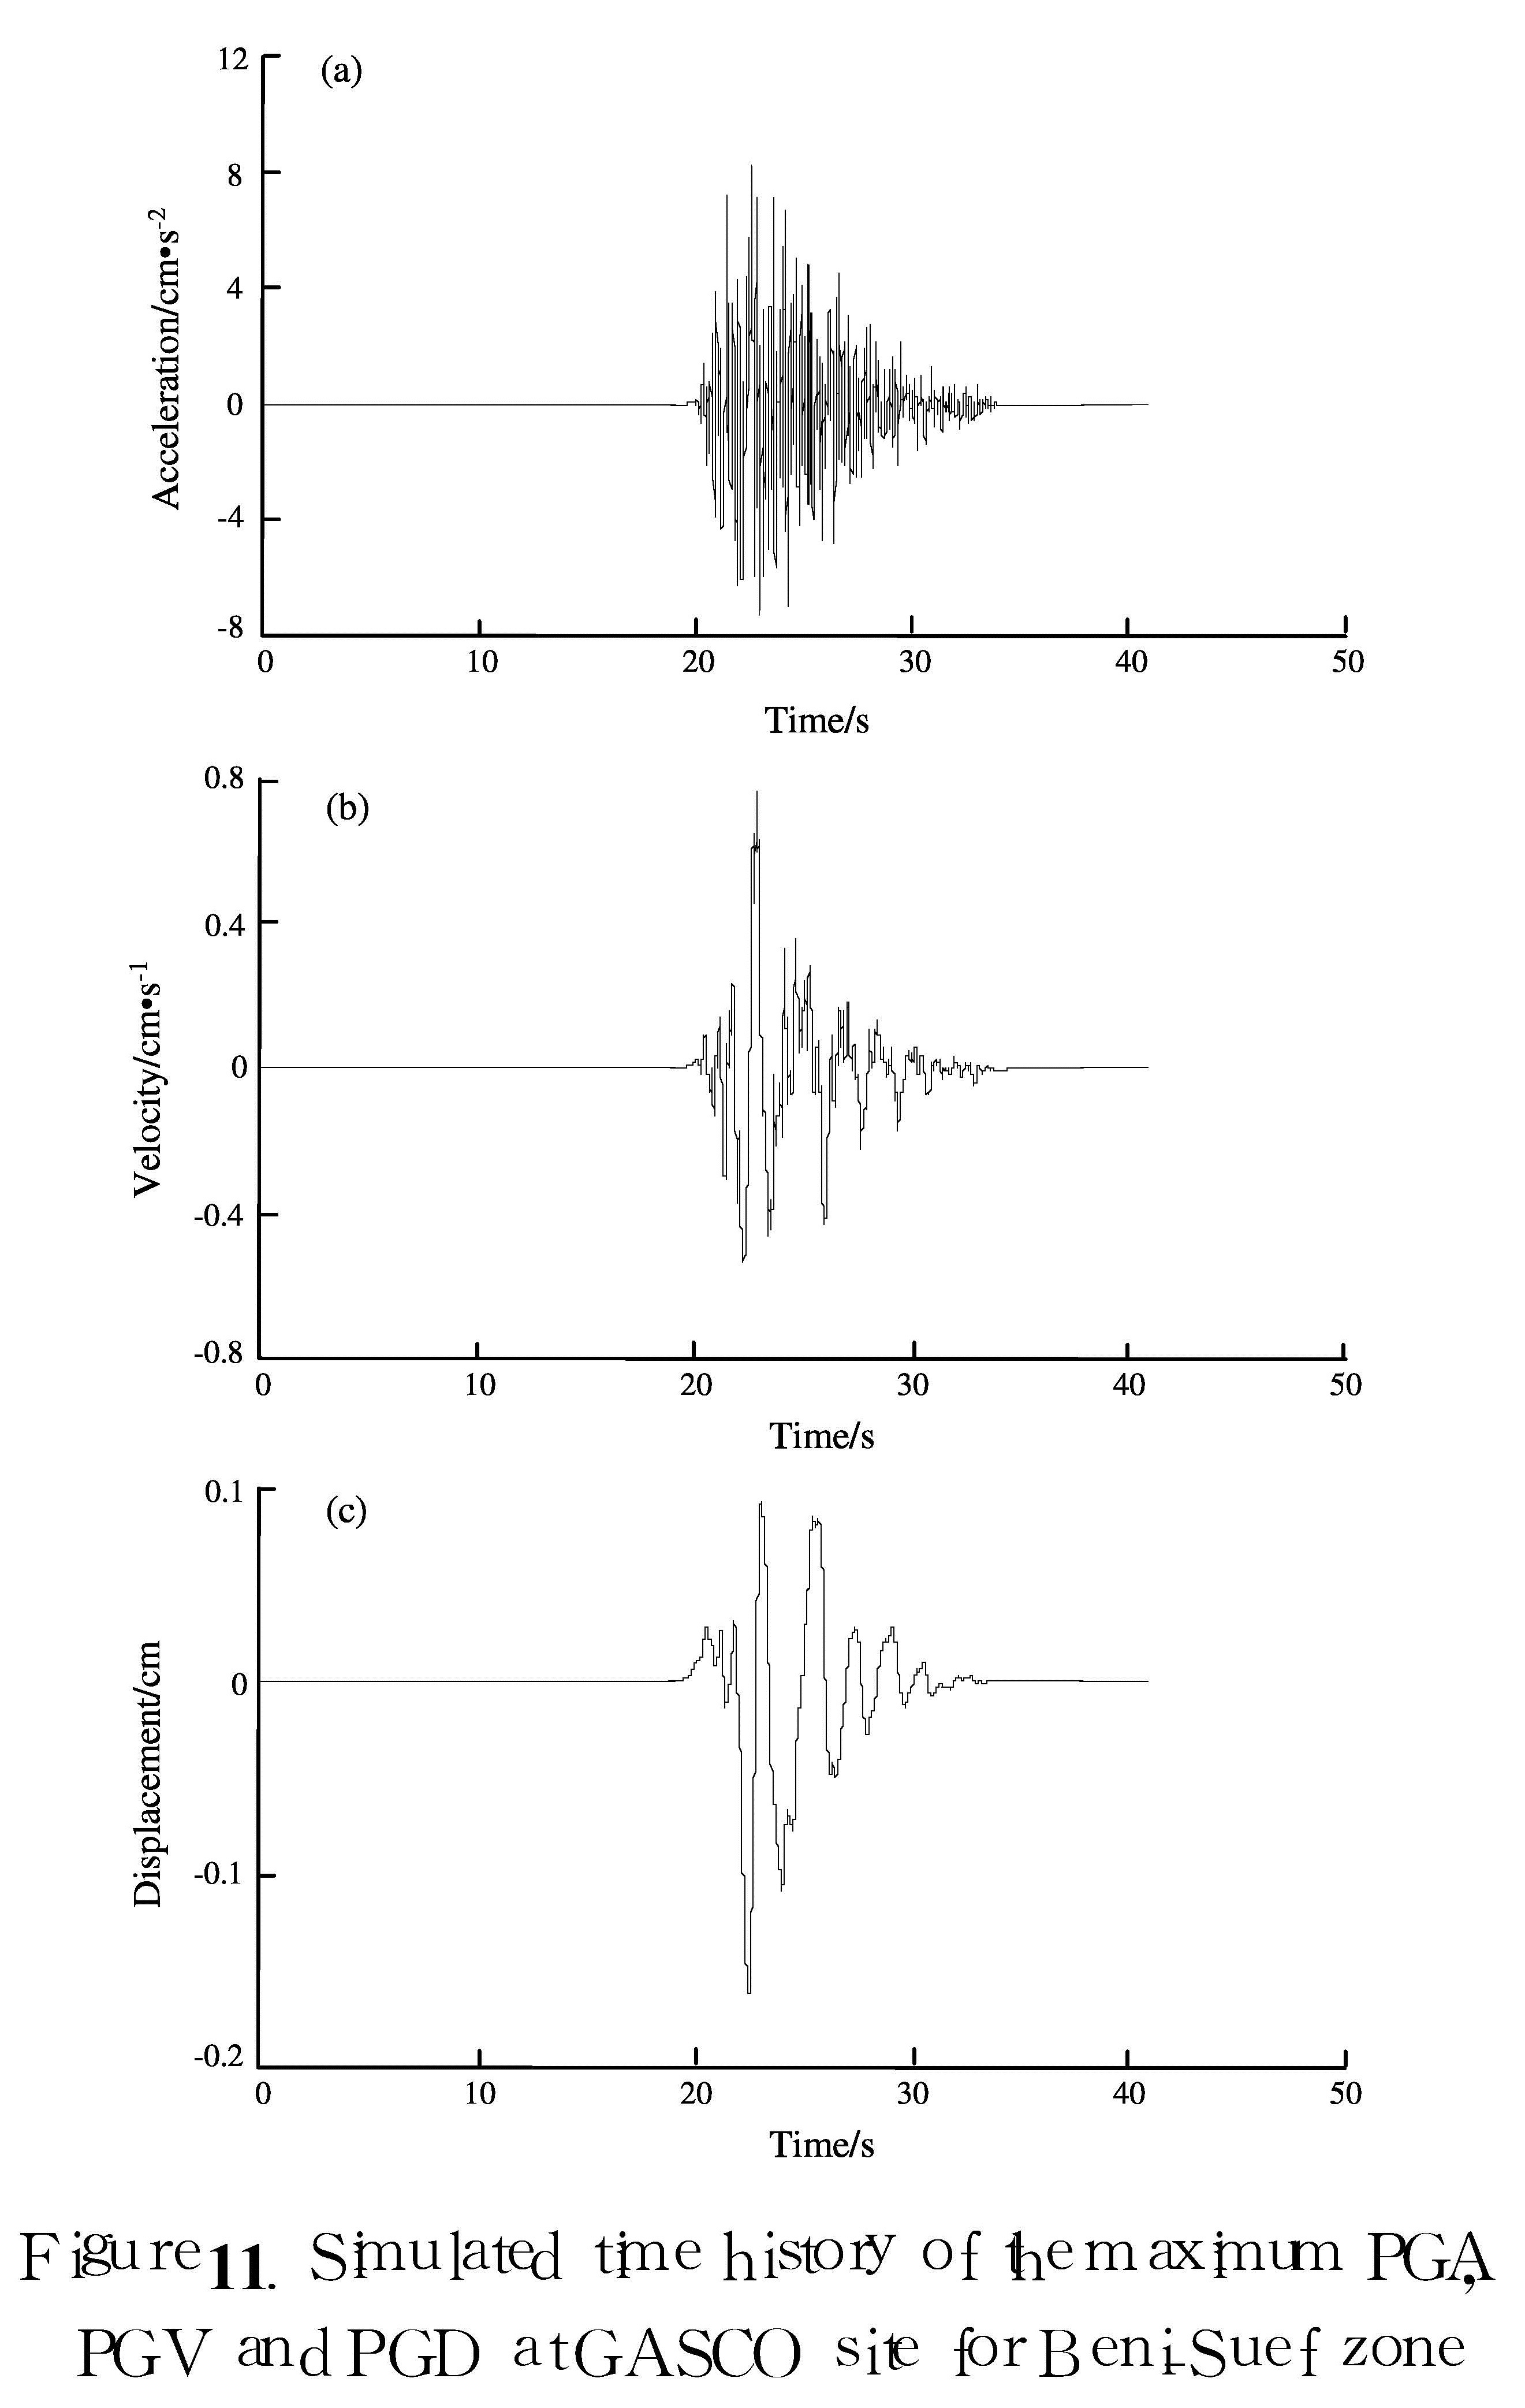
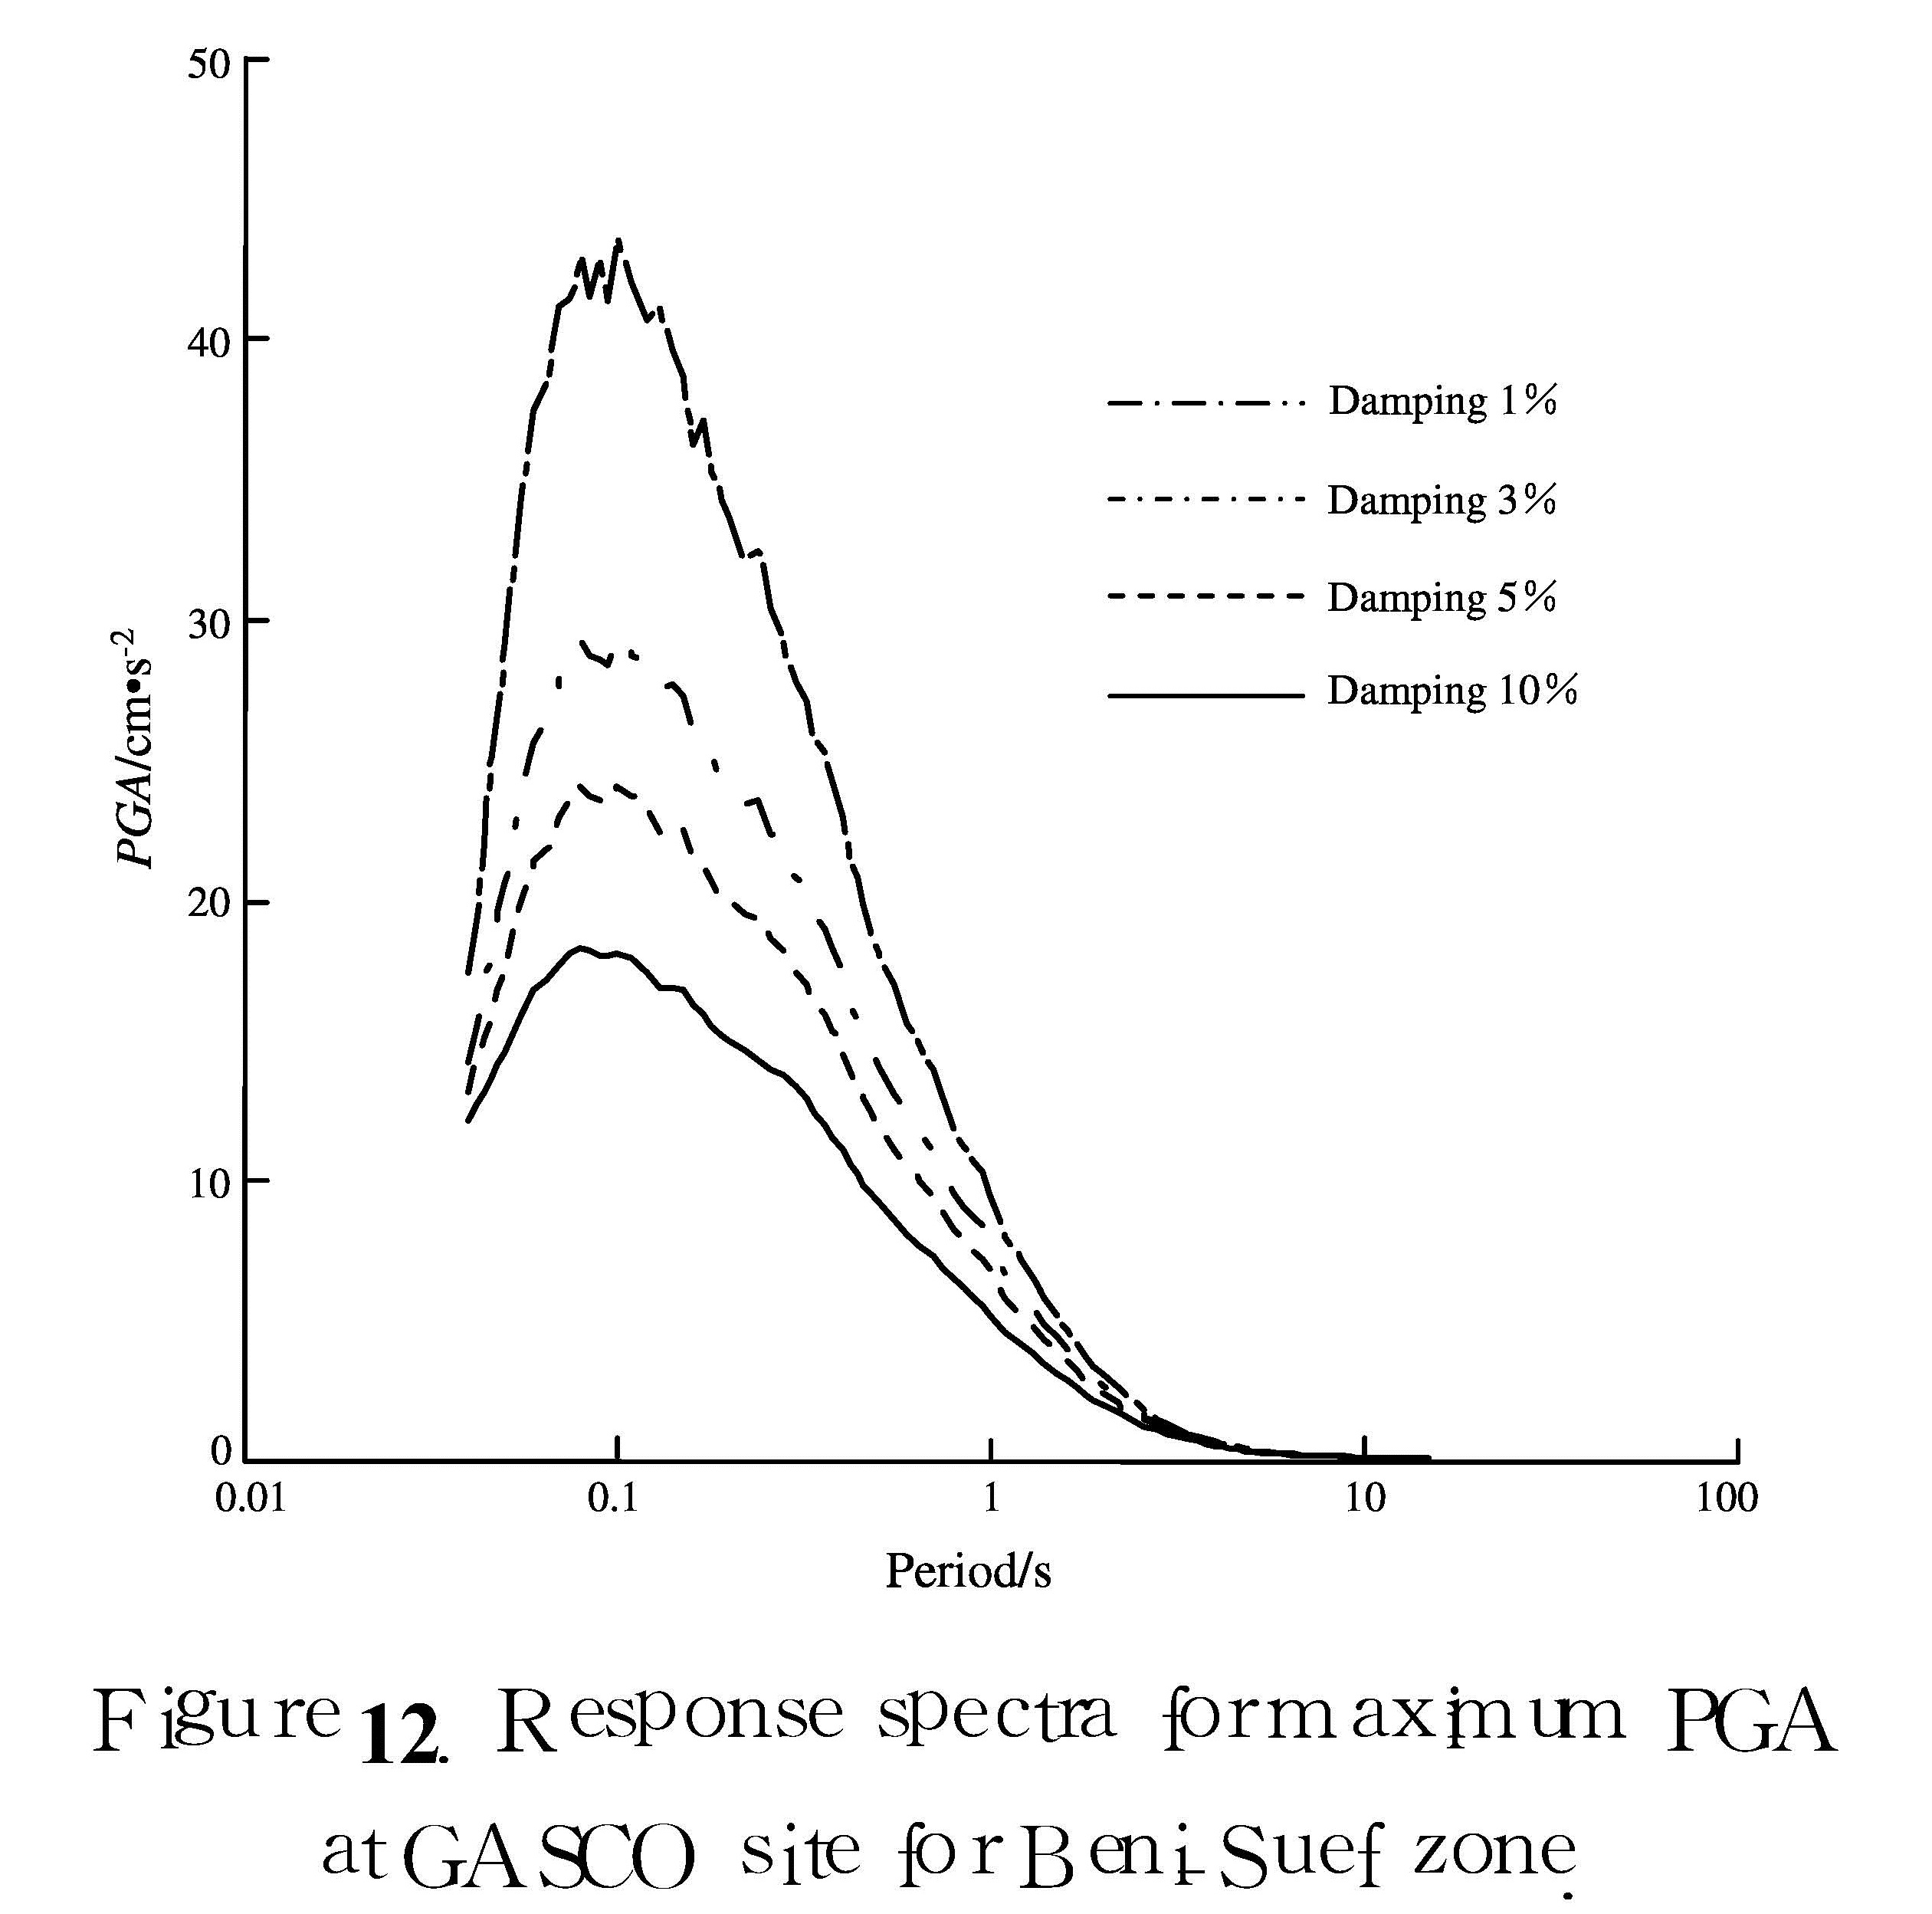
3.3.2 ResultsIt is noticed that,Beni-Suef seismic zone represents the nearest seismic zone to the proposed site(Table 3)and by application of stochastic simulation method,the peak ground acceleration at the site has obtained(Table 4).The simulated time history of PGA,velocity and displacement at the GASCO site for Beni-Suef seismic zones was calculated(Figure 11).
Seismic zone Max.magnitude(MW)Max.PGA/cm·s-2Southwest Cairo 6.31 2.55Beni-Suef 5.6 9.343.3.3 Response SpectraResponse spectra are defined on the basis of the response of single degree of freedom damped oscillator to the earthquake acceleration [Jennings,1983].The response spectra of an accelerogram serve the dual function characterizing the ground motion as a function of frequency and providing a tool for determining earthquake resistant design criteria.The response spectra were calculated with four selected damping values of 1%,3%,5% and 10% of the critical damping at GASCO site for Beni-Suef zone(Figure 12).
