基金项目:“十一五”国家科研计划支撑项目(2006BAC01B04-02-01)资助。
(Earthquake Administration of Sichuan Province, Chengdu 610041, Sichuan, China)
earthquake prediction; reservoir-induced earthquake; v P /vS ratio anomaly; Sichuan
备注
基金项目:“十一五”国家科研计划支撑项目(2006BAC01B04-02-01)资助。
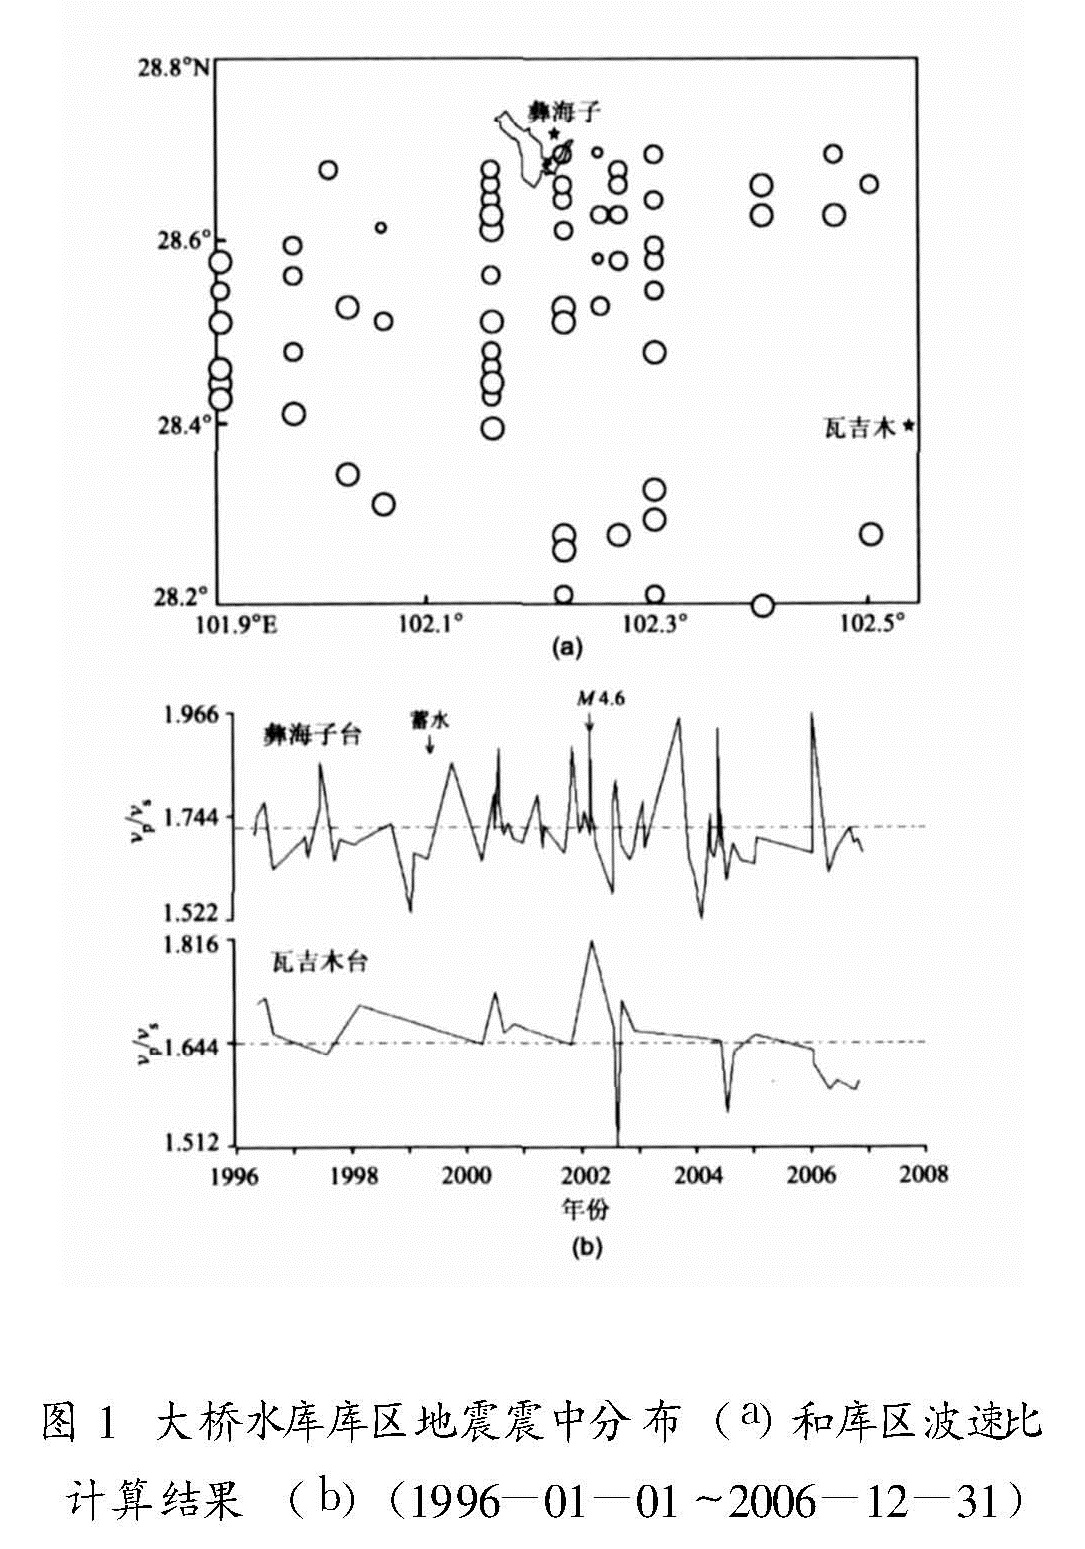
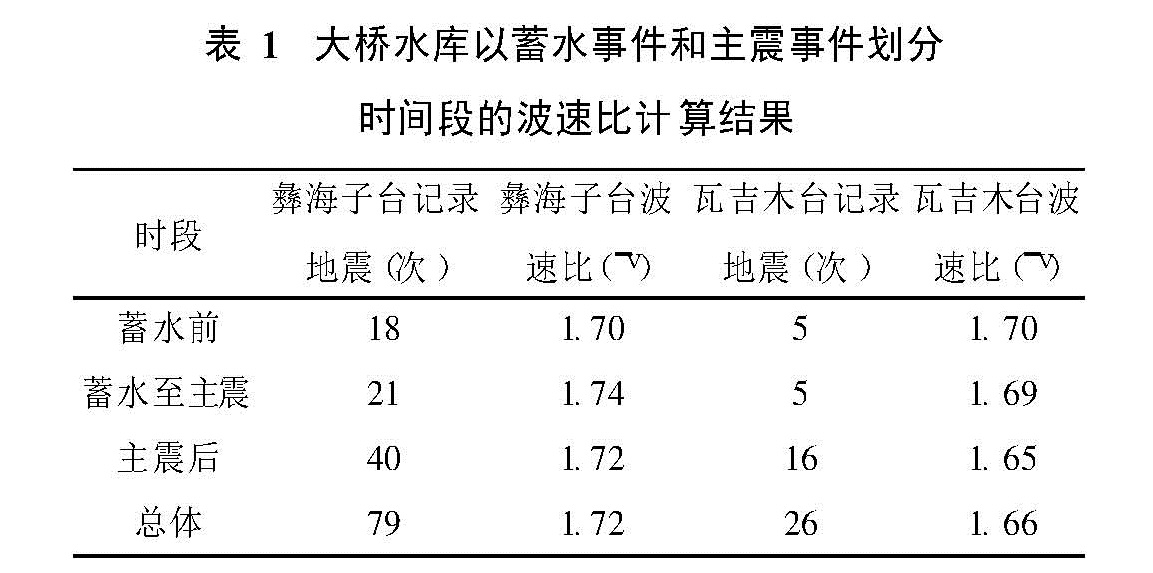
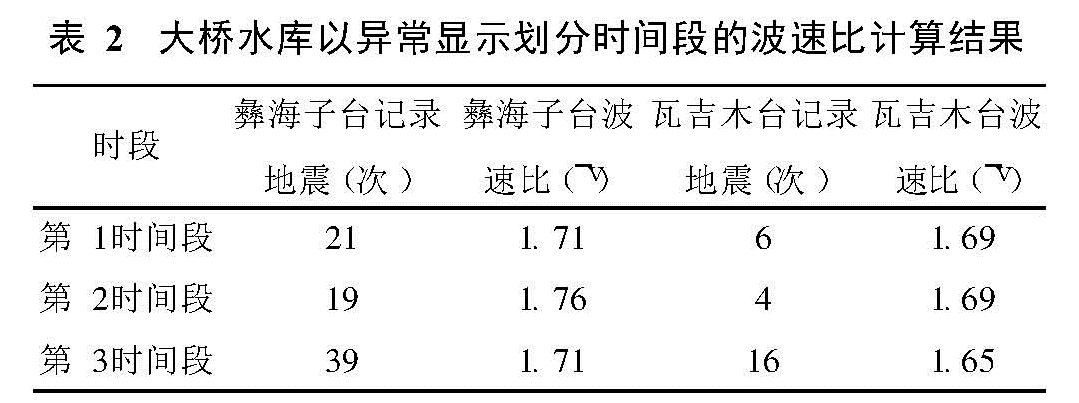
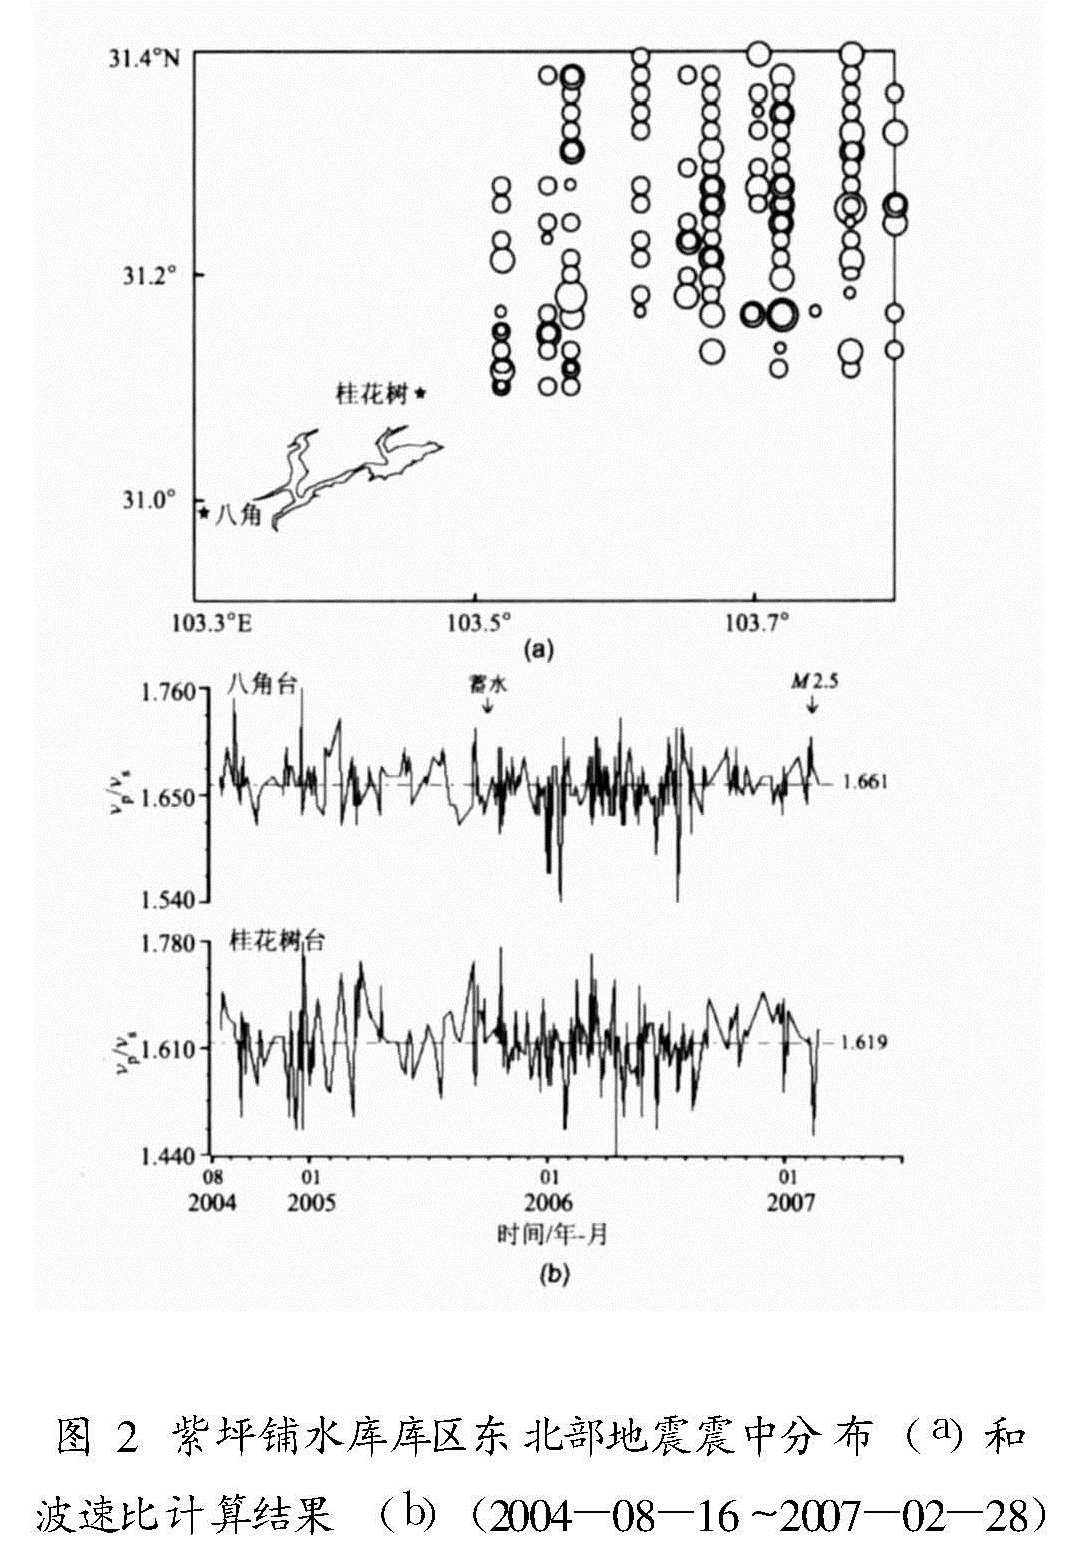
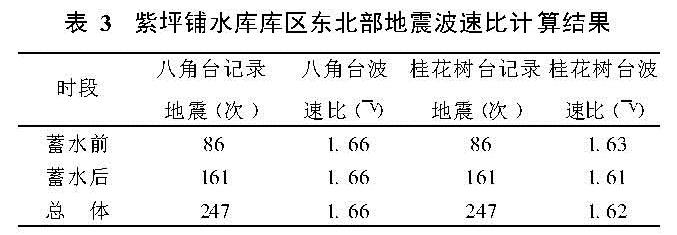
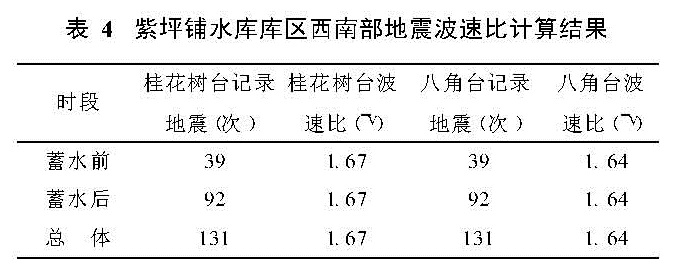
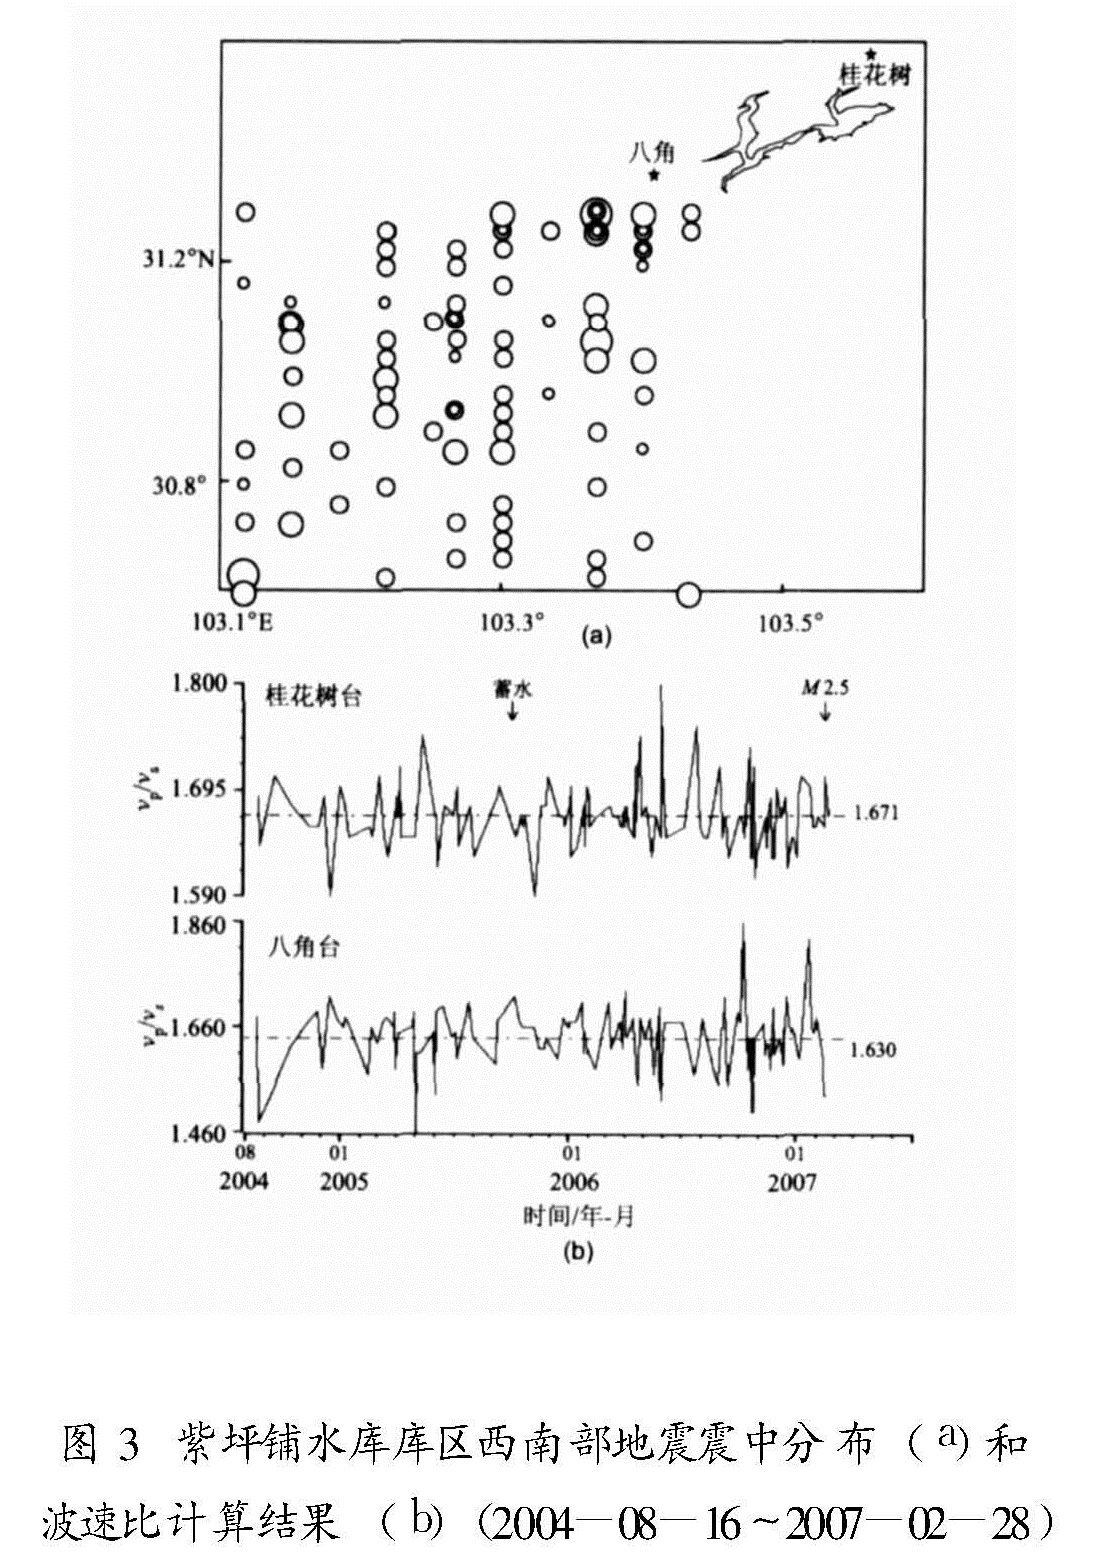
以大桥水库MS4.6诱发地震和紫坪铺水库ML2.5诱发震群为例,研究了穿过水体下方的地震波的波速比在地震前后的变化。由彝海子台记录的穿过大桥水库水体下方的地震波所计算的波速比,在蓄水后4.6级主震前存在高值异常,反映库水对波速比有影响; 由八角台记录的穿过紫坪铺水库水体下方的地震波所计算的波速比显示,在2006年8月28日后一时段库区东北部出现微小的波速比高值异常,结果于2006年10月至2007年2月在八角台附近的汶川水磨发生了2.5级水库诱发震群。因此认为,根据穿过水库水体下方的地震波射线计算的单台波速比,能够反映地震孕育过程中震源及周围地区介质特性的改变,可作为监测水库地震的一种手段。
Taking the Daqiao reservoir-induced earthquake(MS4.6)and Zipingpu reservoir-induced earthquake swarm(the maximum ML2.5)for example, we studied the change of seismic wave velocity ratio before and after the earthquakes using the data of seismic ray that passed through the medium under water body. Based on the Yihaizi station's records(the seismic ray passed through the medium under the water body of the Daqiao reservoir), the velocity ratio showed high-value anomaly after the reservoir impounding and before the earthquake occurring, which reflects the influence of impounding on velocity ratio. Based on the Bajiao station's records(the seismic ray passed through the medium under the water body of the Zipingpu reservoir), the velocity ratio also showed high-value anomaly during a period of time after Aug. 28, 2006; and an ML2.5 earthquake swarm occurred about the Bajiao station in the following months. So, the wave velocity ratio computed by using the data of seismic ray that passed through the medium under the water body of reservoir, can reflect the change of the medium characteristics in and around an epicenter during a seismogenic process, and can be as a way to reservoir-induced earthquake prediction.
引言
较大地震前,由于应力在震源区集中,使得震源及周围地区地下介质性质发生变化,从而导致穿过该区域的地震波的传播速度发生变化。因此,通过研究波速比的变化来预测地震,是地震分析预报中的一种重要方法。上世纪70年代初,日本、美国及其他国家的研究人员相继发现许多地震前存在波速异常现象。我国在波速比研究中已总结出波速比异常时间、幅度、形态与强震的关系,也有预报成功的震例。冯德益(1981)对地震波速和地震波速比研究有系统总结。据研究,在丹江口水库宋湾4.7级地震的孕育与发生过程中,波速比大体经历了4个阶段,即低值异常—高值异常—低值异常—回升发震4个阶段(王静瑶,1984); 新丰江6.1级水库诱发地震前,用水库区域的小台网做的波速比,主震前呈明显的负异常,然后又迅速回升到正常水平,不久即发生6.1级主震(丁原章等,1989)。邹振轩等(2006)用多台和达法计算了2006年2月4日至4月3日发生在温州珊溪水库地区ML≥2.0地震的平均波速比,观察到在较强地震前有持续的波速比低值异常现象,在时间分布上有下降—持续异常—回升—发震的明显异常过程。地震波速比异常分析方法和地震波振幅比等方法有一定映震效果,在未来三峡水库诱发地震预测中是值得尝试的参考方法(严尊国等,2002)。三峡巴东地区地震波速比值变化与水库地震的震源浅、裂隙发育、水的渗入作用等有关,并存在扩容期间波速比降低、震前波速比回升的现象(陈俊华等,2007)。实验表明,岩石的波速比与静水压的关系分为4种类型:① 随压力增加明显下降; ② 随压力增加缓慢上升; ③ 随压力增加缓慢下降; ④ 随压力增加缓慢波动(耿乃光等,1992)。赵晋明等(2001)从实验上确证:岩石在主破裂前一瞬间,纵波速度升高甚至超过原最大值的两倍以上,纵、横波波速比升高至2.5~3.0。
笔者用地震波波速比方法,对2002年3月3日大桥水库诱发4.6级地震和2007年2月12日紫坪铺水库诱发2.5级地震震群进行了研究,观测到了这两个震例前波速比的异常过程,依据新的震例,笔者提出了水库诱发地震中波速比研究方法的新思路。
1 基础理论、研究思路及计算公式
1.1 波速变化的研究当地震波通过未来强震的震源区时,其传播速度可能发生变化,变化量约为百分之几至百分之十几。波速比可由下式计算:
(vP)/(vS)=((λ+2μ)/μ)1/2.(1)
式中λ为应力,μ为弹性模量。不难看出,当震源区的应力状态发生变化时,弹性模量发生变化,因而引起波速比的变化(傅淑芳等,1980)。
1.2 研究思路选用1个台站进行研究,其记录的Pg和Sg波穿越库水淹没区,记录可能携带由于库水荷载和渗透作用造成的库区底部岩石变化的信息。同时选用另1个台作对比研究,认为该台记录的Pg和Sg波没有穿越库水淹没区,对同一次地震2个单台的计算结果进行对比。
蓄水前是饱气带,蓄水后变成为饱水带,水文地质条件发生了本质的变化。这个地带在垂直方向上距离地表数十至数百米,属于地表极浅层的范围; 在水平方向上不超过河谷的第一分水岭,一般小于5 km。断裂带与库水直接接触,或通过次级旁侧断层等与库水保持一定的水力联系(可按主断裂带至库边距离不大于10 km考虑)。蓄水可导致地壳上层(数百米至数千米,极少数情况可达到10 km)的区域应力场发生变化(陈祖安,2000)。
选择的研究区应当满足:作为研究对象的单台,其记录的Pg和Sg波穿越库水淹没区; 作为对比研究的单台,其记录的Pg和Sg波不穿越库水淹没区,计算大桥水库和紫坪铺水库水体下方波速比,以研究波速比在水库地震前后的变化情况。
1.3 单台波速比设台站处在地震异常区内,由震源到台站的距离为R,则纵、横波波速比可用下式求得:
v=(vP)/(vS)=(vP/R)/(vS/R)=(TS)/(TP).(2)
TS、TS分别为S波和P波走时,可表示为:TS=tS-T0,TP=tP-T0,将其代入(2)式简化得
v=1+(tS-tP)/(tP-T0).(3)
式中tS为S波到时,tP为P波到时,T0为发震时刻。利用上式求波速比v值,可从记录图上直接量取tS、tP,关键是求T0。T0一般为多台和达直线定出的平均发震时刻,对定位精度较高的地震,也可以目录中的发震时刻为准(王海涛等,1992)。
1.4 计算方法及公式大桥水库数据来自《西昌大桥地震观测报告》 西昌遥测地震台网,大桥水库地震监测中心.2006.西昌大桥地震观测报告(1996-2006).,分别用来计算彝海子台和瓦吉木台的单台波速比。紫坪铺水库数据选自《紫坪铺数字遥测地震台网地震月报目录及观测报告》 四川省地震局水库地震研究所,四川省地震局地震监测研究所.2007.紫坪铺数字遥测地震台网地震月报目录及观测报告(2004-2007).,分别用来计算桂花树台和八角台的单台波速比。一般而言,波速比以区域小台网中多台记录资料计算,用和达法可以达到较高精度。本文的研究重点是提取用穿过水库蓄水区域底下的地震波射线所反映出的波速比在地震前后的变化,因用和达法得到的结果异常信息不突出,所以根据波速比的定义,选用公式(3)进行计算。
2 大桥水库水体下方的波速比
大桥水库位于安宁河地震带,是国内处于强震多发地区和高地震烈度区唯一的大(二)型水库,坝高93 m,库容6.58×10⁸ m3,1999年5月20日蓄水。水库遥测地震台网于1994年10月试运行,1996年7月通过验收。2001年9~11月库区内有密集分布的高频次的近地表小震群活动,以致库区内地震存在b值与η值等地震学异常(胡先明,2003)。这个小震群震级小、频次高,分布在一个震源深度浅、地域小的空间范围内,小震群为典型的前兆震群(胡先明,2004a)。2002年3月3日08时23分,大桥水库大坝下游3 km处发生4.6级地震,震中烈度为Ⅵ度,冕宁县城震感强烈,大桥水库发电机房预警装置报警,值班人员也感觉到强烈震动,震区民房出现微小裂隙,但地震没有对大桥水库大坝造成影响。笔者根据序列特征、库水位变化与地震的相关性、地震地质构造和震源机制解,判断本次地震为
滞后响应的构造型水库诱发地震,属主震―余震型(胡先明,2004b)。
2.1 选择单台和选取地震1996年1月1日至2006年12月31日,在28.2°~28.7°N,101.9°~102.5°E地区,有319次0.0~4.6级地震可选。选择彝海子台作为水库地震展布区内的研究对象,其记录的地震波都通过库水淹没区。选瓦吉木台的资料作对比,尽量选取相对远离库水淹没区的地震。实际读取1996年1月1日至2006年12月31日间的0.6~2.8级地震79次(图1a),其中:0.6~0.9级地震3次,1.0~1.9级地震46次,2.0~2.8级地震30次。彝海子台记录到79次地震,震中距为2~61 km,平均26 km; 瓦吉木台记录到26次地震,震中距为13~64 km,平均43 km。
计算结果(b)(1996-01-01~2006-12-31)2.2 波速比的计算结果(1)以蓄水事件和主震事件划分时间段
由表1可以看出,彝海子台记录到的79个地震波速比v在1.52~1.96之间,v^-=1.72(图1b)。大桥水库蓄水前有18次地震,v值在1.54~1.86之间,v^-=1.70,比均匀介质状态的理论值31/2小0.03。蓄水后至主震发生(1999年5月20日至2002年3月3日)有21次地震,v值在1.65~1.89之间,v^-=1.74,比理论值大0.01; 主震后有40次,v值在1.52~1.96之间,v^-=1.72,比理论值小0.01。1999年5月20日蓄水后有61次地震,v值在1.52~1.93之间,v^-=1.73,等于理论值31/2。
瓦吉木台共记录到26次地震,单台波速比v值地震在1.51~1.81之间,v^-=1.66(图1b),比理论值小0.07。蓄水前有5次地震,v值在1.65~1.81之间,v^-=1.70; 蓄水后至主震有5次地震,v值在1.66~1.74之间,v^-=1.69; 主震后有16次,v值在1.51~1.81之间,v^-=1.65。
(2)以异常显示划分时间段
由表2可以看出彝海子台和瓦吉木台在1996年1月1日至2006年12月31日间波速比的变化情况。
彝海子台:第1时间段(1996年1月1日至2000年4月10日)有21次地震,v值在1.54~1.86之间,v^-=1.71,比理论值小0.02; 第2时间段(2000年4月11日至2002年3月3日)有19次地震,v值在1.67~1.95之间,v^-=1.76,比理论值大0.03; 第3时间段(2002年3月4日至2006年12月31日)有39次地震,v值在1.52~1.96之间,v^-=1.71,比理论值小0.02。
瓦吉木台:第1时间段有6次地震,v值在1.65~1.73之间,v^-=1.69; 第2时间段有4次地震,v值在1.66~1.74之间,v^-=1.69; 第3时间段有16次地震,v值在1.51~1.81之间,v^-=1.65。
(3)结果对比解释
彝海子台单台波速比平均值v^-=1.72,比瓦吉木台的v^-=1.66高出0.06,彝海子台的波速比均值更接近理论值31/2。在以蓄水和主震事件划分的3个时段里,彝海子台比瓦吉木台的波速比分别高出0、0.05、0.08,即蓄水前两台v值是一致的,蓄水后至主震彝海子台明显高于瓦吉木台,主震后彝海子台显得更高。在以异常显示划分的3个时段中,彝海子台比瓦吉木台的波速比分别高出0.02、0.07、0.06,即蓄水前至蓄水初期彝海子台比瓦吉木台高,蓄水初期至主震前彝海子台比瓦吉木台明显要高,主震后彝海子台比瓦吉木台明显要高。通过上述对比可以得出:两台的波速比在蓄水前有差异,蓄水后至主震差异更突出,主震后差异变小。
彝海子台在蓄水后至主震间v^-=1.74,或蓄水初期与主震间v^-=1.76的高值现象,显示彝海子单台记录的穿过水库蓄水区域底下的地震波射线的波速比,由于受库水影响,高于当地的波速比平均值,表明大桥水库蓄水对水体下方岩石的地震波传导性质有影响。
3 紫坪铺水库水体下方波速比
紫坪铺水库位于龙门山断裂带的岷江上游都江堰市麻溪乡,水库为大(一)型工程,坝高156 m,库容11.12×10⁸ m3,2005年9月30日蓄水。紫坪铺水库数字遥测地震台网于2004年8月试运行,2005年6月通过验收。2004年8月16日至2007年2月28日,在30.6°~31.4°N,103.1°~103.9°E地区,台网共记录到-0.9~3.9级地震1 738次。2006年9月至10月水库快速蓄水后,于2007年2 月发生了ML2.5地震群,笔者认为,这是与水库快速蓄水有关的水库诱发地震群胡先明,韩进,谢蓉华,等.2008.紫坪铺蓄水后的水库地震监测预测[J].四川地震,待刊.。
3.1 紫坪铺库区东北部地震的波速比(1)选择单台和选取地震
2004年8月16日至2007年2月28日,库区东北部(31.1°~31.4°N,103.6°~103.9°E)共发生345次0.5~3.6级地震。八角台在水库地震震群展布区内,选取地震波通过库水淹没区的记录,并与相对远离库区的桂花树台的地震波记录作对比。实际读取2004年8月16日至2007年2月28日,八角台和桂花树台都记录到的0.6~3.6级地震247次(图2a),其中,0.6~0.9级32次,1.0~1.9级171次,2.0~2.9级地震41次,3.0~3.6级地震3次。震中距离八角台23~63 km,平均44 km,距离桂花树台4~44 km,平均25 km。
表3给出了紫坪铺水库库区东北部地震波速比计算结果。(2)波速比的计算结果
由八角台资料计算所得的波速比在1.54~1.76之间,v^-=1.66(图2b),比理论值小0.07。蓄水前(2005年9月30日前)有86次地震,波速比在1.62~1.76之间,v^-=1.66。蓄水后(2005年9月30日后)有161次地震,波速比在1.54~1.73之间,v^-=1.66。个别的极值点差异较大,整体上看不出蓄水前与蓄水后波速比的显著变化。相对较为明显的变化是2006年8月28日后, 有38个地震的v值有整体变大的情况,该时段波速比v在1.63~1.71之间,v^-=1.67。
桂花树台波速比在1.44~1.78之间,v^-=1.62(图2b)。蓄水前(2005年9月30日前)有86次地震,波速比在1.48~1.78之间,v^-=1.63; 蓄水后(2005年9月30日后)有161次地震,波速比在1.44~1.77之间,v^-=1.61。个别的极值点差异较大,整体上看不出蓄水前与蓄水后波速比有明显变化。2006年8月28日后有38个地震的v值在1.47~1.70之间,v^-=1.63。
(3)八角台与桂花树台的波速比结果比较
八角台单台波速比平均值为1.66,比桂花树台的平均值1.62高0.04,八角台的波速比平均值更接近理论值31/2。蓄水前八角台单台波速比平均值为1.66,比桂花树台的平均值1.63高0.03; 蓄水后八角台单台波速比平均值为1.66,比桂花树台的平均值1.61高0.05。2006年8月28日后的时段内地震的波速比相对较为突出,比八角和桂花树两台的波速比平均值整体高出0.01。2006年10月至2007年2月,在八角台附近的汶川水磨发生2.5级地震震群。
3.2 紫坪铺水库库区西南部地震的波速比(1)以单台记录选取地震
2004年8月16日至2007年2月28日,紫坪铺水库库区西南(30.6°~30.95°N,103.1°~103.45°E)有240次0.5~3.9级地震可选。实际选取2004年8月16日至2007年2月28日,桂花树和八角台都记录到的0.5~3.9级地震131次(图3a),其中,0.6~0.9级地震30次,1.0~1.9级地震82次,2.0~2.9级地震16次,3.0~3.9级地震3次。震中距离桂花树台20~70 km,平均为40 km; 距离八角台3~51 km,平均为22 km。计算结果见表4。
(2)波速比的计算结果
桂花树台波速比值在1.59~1.80之间,v^-=1.67(图3b),比理论值小0.06。蓄水前(2005年9月30日前)有39次地震波速比在1.59~1.75之间,v^-=1.67; 蓄水后(2005年9月30日后)有92次地震,波速比在1.59~1.80之间,v^-=1.67。虽然个别的极值点与平均值差异较大,但整体上看不出蓄水前与蓄水后波速比有明显变化。
八角台波速比在1.46~1.86之间,v^-=1.64(图3b),比理论值小0.09。蓄水前(2005年9月30日前)有39次地震,波速比在1.46~1.72之间,v^-=1.64; 蓄水后(2005年9月30日后)有92次地震,波速比在1.50~1.86之间,v^-=1.64。虽然个别的极值点与平均值差异较大,但整体上看不出蓄水前后波速比有明显变化。
(3)桂花树台与八角台的单台波速比计算结果比较
桂花树台单台波速比平均值为1.67,比八角台的v^-=1.64高0.03,桂花树台更接近理论值31/2。桂花树台与八角台的单台波速比在时序上看不出差异。
上述对紫坪铺水库的研究,是以桂花树台和八角台的记录资料作为研究对象和比对目标,对库区东北部247次地震和库区西南部131次地震穿过蓄水区域底部的地震波射线,计算出其单台波速比。八角台的计算结果显示,在2006年8月28日后这个时段内,库区东北部地震波速比有微小高值异常,比库区整体波速比平均值高0.01。
4 讨论与结论
(1)大桥水库库区选取的79次做波速比的地震距离彝海子台2~61 km,平均26 km; 距离瓦吉木台13~64 km,平均43 km。彝海子台记录的通过水体下方的地震波波速比平均值为1.72,比瓦吉木台的波速比平均值1.66高0.06,彝海子台的波速比平均值更接近理论值31/2。所选紫坪铺水库库区东北部做波速比的247次地震,距离八角台23~63 km,平均44 km; 距离桂花树台4~44 km,平均25 km。用八角台记录计算得到的通过水库水体下方的地震波波速比平均值为1.66,比桂花树台的1.62高0.04,因此,八角台的波速比平均值更接近理论值31/2。所选紫坪铺水库库区西南部做波速比的131次地震,距离桂花树台20~70 km,平均40 km; 距离八角台3~51 km,平均22 km。桂花树台记录到的通过水体下方的地震波波速比平均值为1.67,比八角台的1.64高0.03,桂花树台的波速比平均值更接近理论值31/2。
由上述可见,由彝海子、八角和桂花树3个台的单台记录计算所得的水库水体下方波速比平均值均高于与其作为对比的瓦吉木台、桂花树台和八角台,同时彝海子台的单台波速比平均值v^-更接近理论值31/2。在做波速比研究时应当考虑震中距对波速比的影响,本文选取的地震的震中距都小于70 km,地震分布相对集中在本文所选取计算的地震范围中,震中距不可能影响到波速比。
(2)波速异常的一般形态是在地震前为负值异常(梅世蓉等,1993),而本研究所得结果为正值异常,与以前的波速异常的一般形态不同。耿乃光等(1992)的实验表明岩石的波速比与静水压的关系有四种类型; 赵晋明等(2001)从实验上证明岩石在主破裂前一瞬间波速比升高甚至达2.5~3.0。笔者认为波速异常可能有不止一种形态,有可能存在正值异常。
用穿过水库蓄水区域下方的地震波射线所做的单台波速比,能够反映地震孕育过程中震源及周围地区的介质特性发生的改变,因而可以作为水库地震的监测手段。大桥水库4.6级主震前单台波速比的高值过程,反映水库蓄水对水体下方的岩石传导地震波有影响。2006年8月28日后这一时段,八角台的记录反映紫坪铺水库库区东北部的地震在八角台有微小高值异常,该异常对应了2006年10月至2007年2月期间在八角台附近的汶川水磨发生的2.5级水库诱发地震震群。
- 陈俊华,甘家思,李普丽,等.2007.三峡水库蓄水后巴东地区波速比(VP/VS)研究[J].大地测量与地球动力学,27(专刊):12-14.
- 陈祖安主编.2000.中国水力发电工程(工程地质卷)[M].北京:中国电力出版社.
- 丁原章.1989.水库诱发地震[M].北京:地震出版社.
- 冯德益.1981.地震波速异常[M].北京:地震出版社.
- 傅淑芳,刘宝诚,李文艺,等.1980.地震学教程(下册)[M].北京:地震出版社.
- 耿乃光,郝晋升,李纪汉,等.1992.岩石的波速比与静水压的关系[J].地震学报,14(4):501-506.
- 胡先明.2003. 大桥水库诱发4.4级水库地震前的地震学异常[J]. 地震地磁观测与研究,24(3):14-19.
- 胡先明. 2004a. 大桥水库诱发地震前的小震群.四川地震,(2):36-41.
- 胡先明.2004b.冕宁大桥水库诱发地震研究[J].大地测量与地球动力学,24(2):88-91.
- 梅世蓉,冯德益.1993.中国地震预报概论[M].北京:地震出版社.
- 王海涛,敖雪明,杨马陵,等.1992.单台地震预报的地震学方法[M].北京:地震出版社.
- 王静瑶.1984.丹江口水库蓄水后的波速比异常[M]//:国家地震局地震研究所.中国诱发地震.北京:地震出版社,78-84.
- 严尊国,杨福平,周昕,等. 2002.未来长江三峡水库诱发地震的预测技术探讨[J].大地测量与地球动力学,22(1):101-109.
- 邹振轩,李金龙,俞铁宏.2006.应用多台和达法测定温州珊溪水库地区地震的平均波速比[J].地震,26(4):133-137.
- 赵晋明,胡毅力,杨润海,等.2001.岩石临破坏前波速奇异变化的再研究[J].地震研究,24(2):136-139.