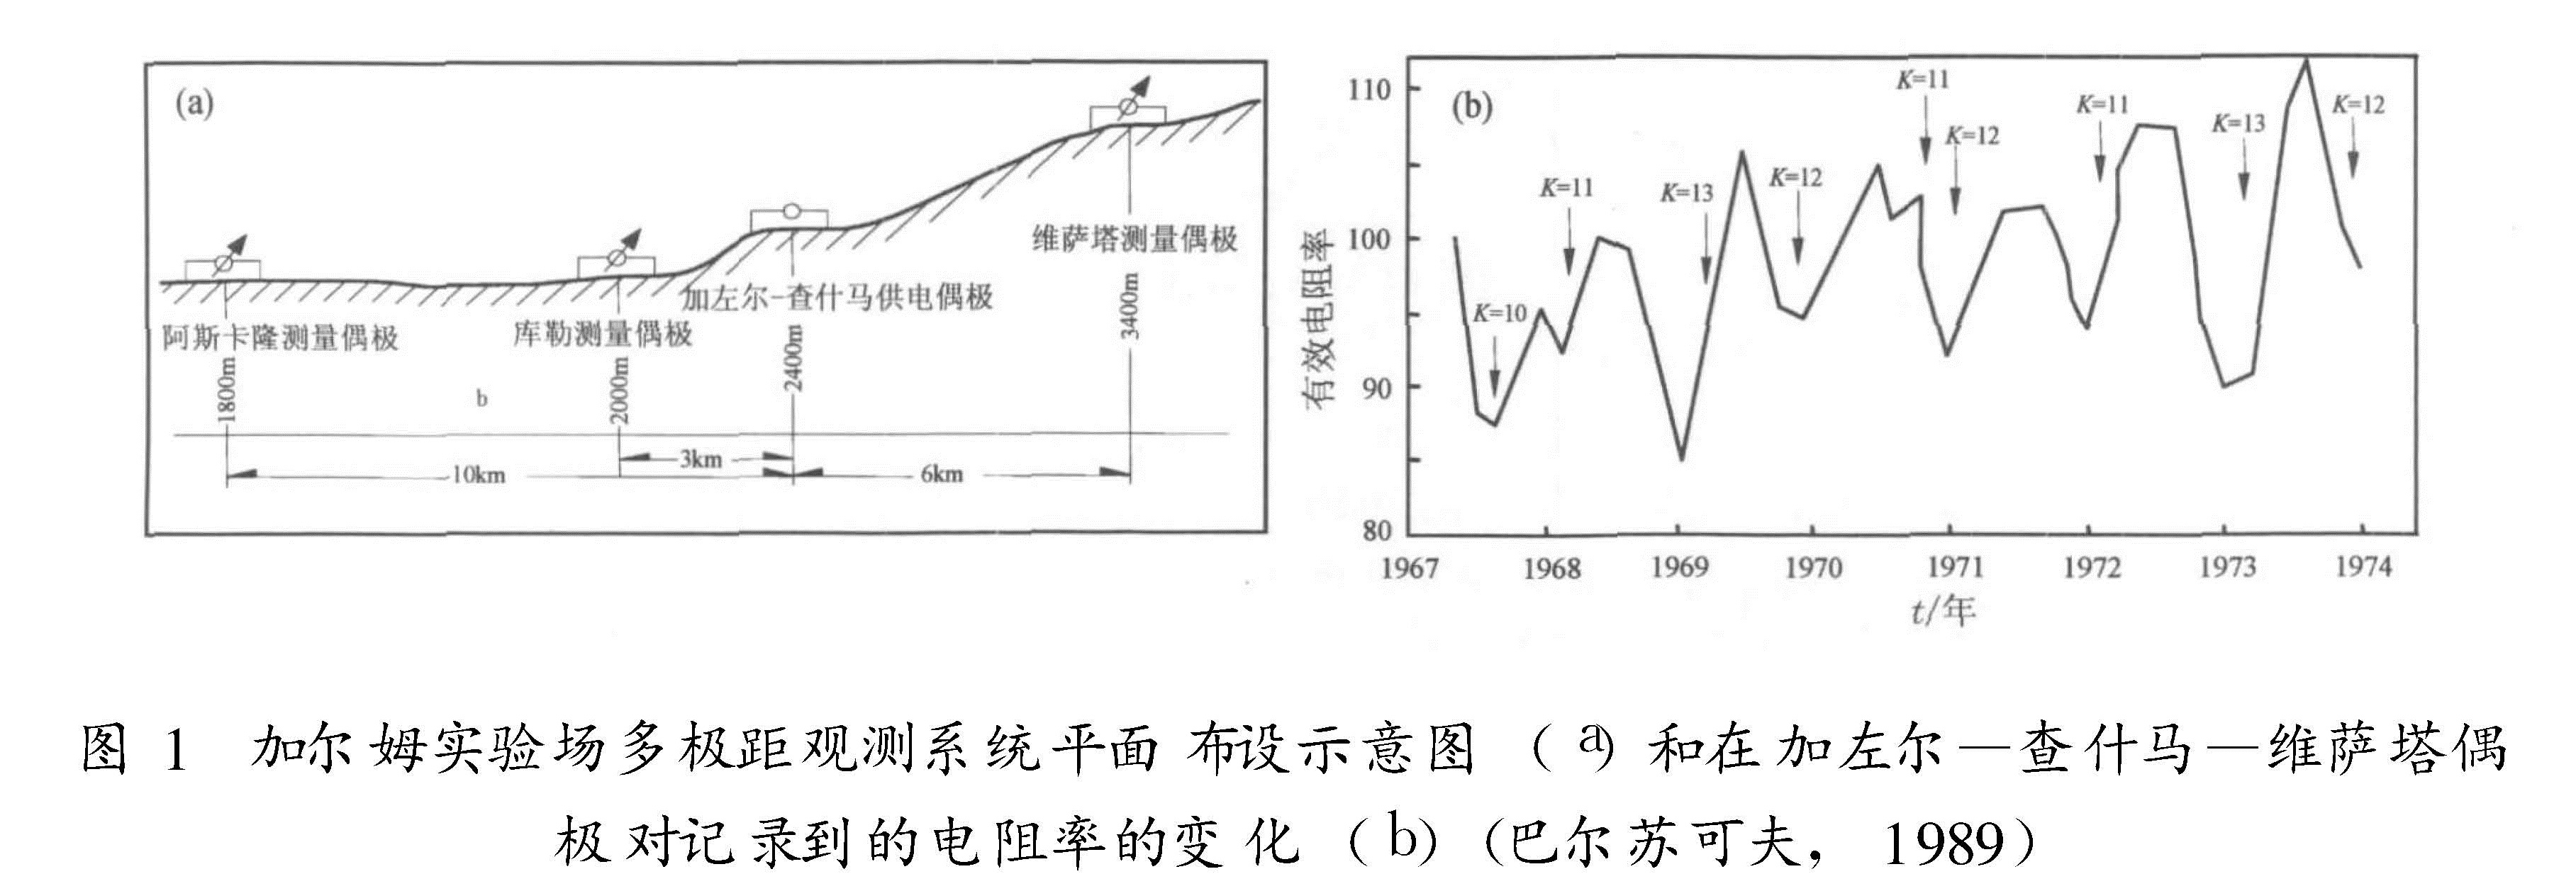
基金项目:国家科技基础条件平台重点项目“数字地震前兆观测地电方法标准”(2004DEA71000)资助.
(1.Earthquake Administration of Yunnan Province,Kunming 650224,Yunnan,China)(2.Institute of Earthquake Science,CEA,Beijing 100036,China)
earth resistivity; multi-separation array observation; progresses; present situation
备注
基金项目:国家科技基础条件平台重点项目“数字地震前兆观测地电方法标准”(2004DEA71000)资助.
回顾了国内外地震地电阻率多极距观测与研究的发展历程,阐述了多极距观测在机理方面的优势,对其现状和存在的问题进行了分析。分析指出:随着地震预测从经验预报向物理预报的发展,多极距观测系统的建立和反演技术的应用将会受到越来越多的重视。
We review the progress of earth resistivity observation with multi-separation array in earthquake prediction in the world,discuss its advantages in physic mechanism and analyze its present situation and existed problems.The analysis points out that with the development of earthquake prediction from experiential to physical research,the construction of multi-separation array observation system and the application of inversion technology will get more and more attention.
引言
电阻率多极距观测是相对于单极距观测而言的,本文中电阻率多极距观测指的是一个供电偶极建立人工电场、多个测量偶极测量视电阻率,观测既可采用常见的对称四极装置,也可采用各种偶极—偶极装置。地震地电阻率多极距观测方法的核心是,希望通过不同极距的地电阻率观测“反演”地下介质中实际发生的不同部位的真电阻率的变化过程,为研究它们与地震或非地震的物理因素之间的关联提供依据,为识别干扰影响和提取地震异常信息提供重要的技术手段。
1 国外研究情况
1.1 前苏联上世纪70年代中期,在前苏联塔吉克共和国加尔姆地震预报实验场和吉尔吉斯共和国伏龙芝地震预报实验场的地电阻率观测中,采用了一种功率很强的供电电源——磁流体发电机供电,其功率从数兆瓦到25 MW,提供的电流可达1 000 A,在如此强大的电流下,采用多极距观测台阵的方式,在距供电偶极不同的距离上设置测量偶极进行测量(巴尔苏可夫,1989)。图1a是加尔姆实验场多极距观测系统的平面布设示意图,供电偶极位于测区中部,在供电偶极两侧共计设置了3对测量偶极,最大偶极距达10 km。因此从垂直剖面上看,他们的实验实际上是针对不同深度的探测及其随深度的变化。在伏龙芝实验场,观测偶极到供电偶极的最远距离达60 km,其探测深度很大。当时还是采用人工读数的模拟仪器进行观测,所以在伏龙芝实验场,观测时甚至用直升飞机运送观测人员往返。可以说,前苏联地震地电前兆的探索是从地电阻率多极距观测开始的。
极对记录到的电阻率的变化(b)(巴尔苏可夫,1989)前苏联长期观测的结果表明,地电阻率多极距台阵试验中,在台网内或其边缘所发生的中强地震前,地电阻率异常形态以下降的中期趋势变化为主,异常幅度为百分之十几,持续时间为数月。图1b是加尔姆实验场多极距多年观测中一对距供电偶极距离为6 km的测点的地电阻率与地震的对应关系图,图中箭头(表示地震时间)上方标有地震的强度,用能级K标识,其中最大的一次地震K=13,相当于一次6级左右地震。由图可见,在测区附近的中强地震前,地电阻率可以观测到百分之几到百分之十几的以下降为主的异常变化。在1973年年初的一次K=13的地震前,地电阻率下降幅度达到15%。
(a)1973年6月22日M4.2地震;(b)1977年12月15日M4.0地震1976~1977年加尔姆实验场还曾扩大试验规模,设置了6个偶极测点,在距供电偶极35~40 km的范围进行多极距地电阻率测量,以便获取12~20 km深处的地壳电性变化与地震间关系的信息。然而,以磁流体发电机技术为基础的观测毕竟是一项花费极为昂贵的实验。显然,在地震前兆观测实践需要长期连续进行的条件下,采用磁流体发电机长期工作实际上是无法维持的。因此,在前苏联的这两个实验场,地电阻率的观测周期都从原来每周一次逐渐改为一个月一次,最后连一个月一次的观测都无法维持。于是对供电电源的技术改造开始实施——寻求商用供电电源。上世纪80年代初期,这两个实验场开始用大功率变压器供电、观测系统采用类似于中国的四极对称装置的观测实验,该装置中设置了多极距观测系统,最大供电极距约3 km左右。总的来看,前苏联的研究带有强烈的实验场特色。
前苏联地电阻率(以及其它前兆手段)的观测研究结果为各国地震前兆综合机理的研究者所重视,曾被作为孕震模式的重要限制条件之一。但是,尽管这些结果都是在多极距观测系统上获得的,但是前苏联地震学者并没有对多个极距的结果进行认真的分析和对比,从中得出更有意义的结论。这或许是由当时的历史条件或数值模拟的技术条件所限。因为在当时,电测深的反演技术主要依靠采用量板的水平。
1.2 美国美国的地电阻率观测与研究迟于日本、前苏联和中国,但其对从极距为数百米的四极对称装置到中心距为数千米、十几千米的偶极台阵(Mazzella等,1974)都进行过实验。其中,偶极台阵由美国加州大学伯克利分校的Morrison教授于上世纪70年代在加利福利亚建立。该台阵也是用偶极装置开展多极距观测实验,测量偶极沿加州圣安德列斯断层延伸布设,以85 kW的功率在供电偶极供电,监测各测量偶极上地电阻率随时间的变化。图2a是一次浅源中强地震(1973年6月22日,M4.2,深度为9 km)前多极距台阵中不同测距上所观测到地电阻率变化,其中较远处(10 km和15 km)的测点显示出大于10%的异常变化,比近处(1.5 km)的测点异常显示明显得多。类似的例子在1977年12月15日发生的一次4级地震前也可见到(图2b)。由于地震发生在台阵的内部,因此这一现象当时受到美国许多地震学者的重视,连同前苏联在加尔姆一次6级地震前地电阻率台阵所记录到的震前下降变化(15%)的事实,成为了美国以Brace和Scholz为代表的“地震前兆膨胀扩散模式”(D-D模式)的重要依据和约束条件。在Brace的模式研究中,地电阻率的下降与波速比的下降、水氡的上升和地形变定点水准的变化相并列。
和前苏联的多极距地电阻率观测研究一样,尽管美国多极距观测系统产出的观测结果曾经受到广泛的关注,但是对多个极距观测结果的综合分析研究却未见报道,总体上还只是停留在相互之间形态对比的阶段。
1.3 日本日本是世界上开展地电阻率地震观测的国家之一,其中东京大学地震研究所所长行武毅等(1980)用地电阻率多极距观测方法监测了与火山活动和地震有关的地电阻率变化,在跨越火山口的方向上,采用偶极装置系统,布设三套偶极,通过对不同电极组合得到归一化地电阻率随时间变化的结果(图3),并据此分析地震前隐伏的岩浆升降运动。
2 国内实践
2.1 地电阻率多极距观测问题的提出
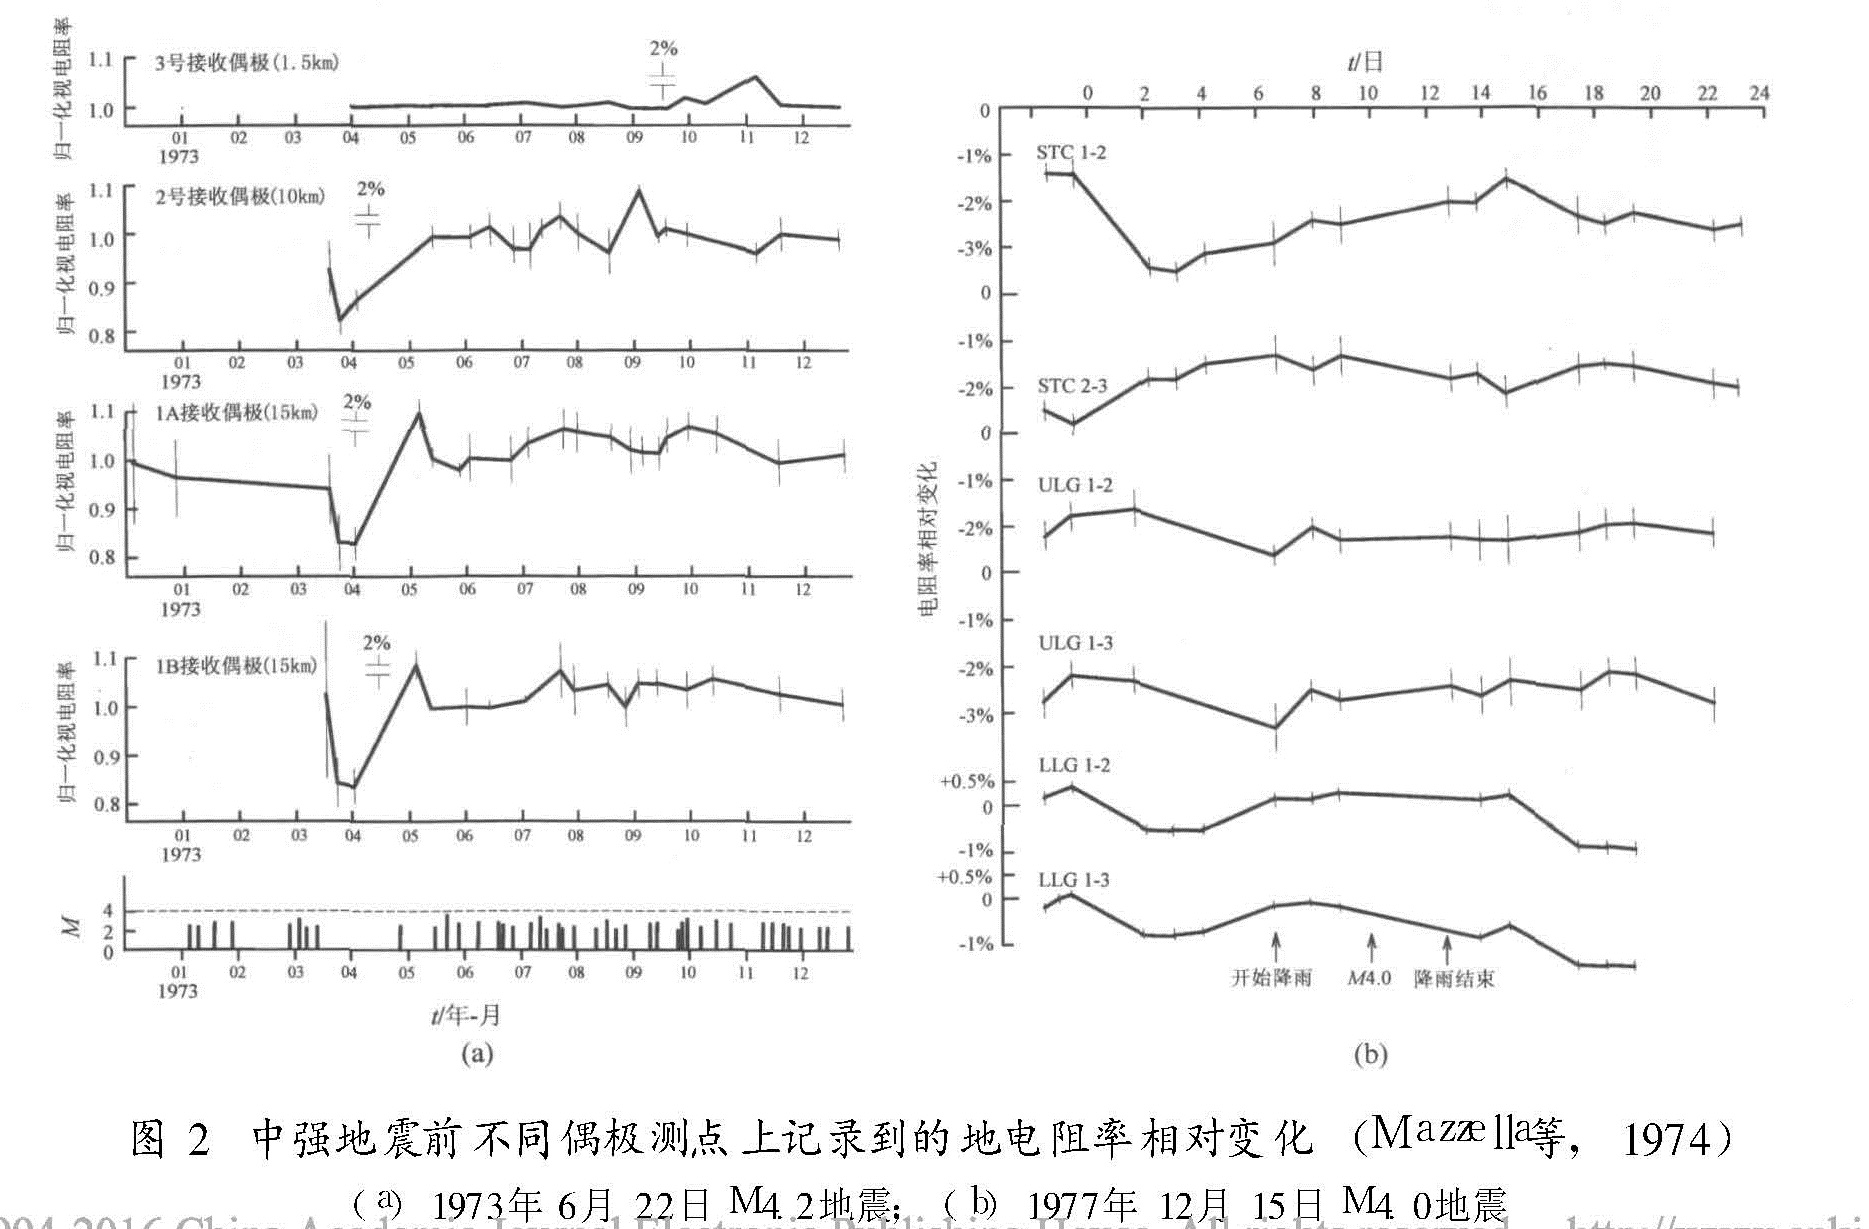
地电阻率多极距观测是在国内地电阻率长期观测实践和理论研究的基础上提出的。在地电阻率的多年观测实践中,一种以年为周期的地电阻率变化逐渐为人们所认识。观测事实表明,地电阻率年变化除了其周期性特点外,不同地区的差异性是其显著的特征,其中包括幅度差异悬殊、位相差异明显和频谱结构差异明显(钱家栋等,1985)。理论研究表明,导致地电阻率年变化的物理原因一般与地震孕育过程无关,主要与观测场区表层电阻率受季节性降水等因素的影响密切关联。在大体相同的季节性因素影响下,相距不远的观测点其电阻率年变化规律可能有明显差异,原因就在于不同观测点下方电性结构的差异。地电阻率数值模拟的研究表明,模拟一个具有相同幅度的表层电阻率年周期变化,在具有不同电性结构的观测点,其地电阻率会有明显的差异:幅度差异、位相差异和频谱成分差异(首先是单一年周期一般会变为多组分频谱结构)均会发生(赵和云等,1987)。
如何识别和消除年变化复杂的影响因素,是摆在地震地电学者面前的一个重要课题。仿效物探电法测深原理,显然是最好的途径和方法。即使用类似于测深的方法,用多极距观测认识探测点下方电性结构的空间分布,采用多极距观测地电阻率随时间的变化来认识探测点下方介质真电阻率随时间的变化。与和统计相关的方法相比,这可能是物理基础最清晰的办法。钱家栋等(1985)在《地电阻率方法在地震预报中的应用》一书中正式提出,应当开展地电阻率多极距观测系统的研究和应用。
2.2 四川郫县台多极距观测试验1984年,兰州地震研究所薛顺章等(1994)与四川省地震局郫县台合作,在郫县台一条测线方向上架设了5个极距不等的四极对称装置系统,开始了长达5年的地电阻率多极距观测系统的观测实验(图4a)。
1987年,赵和云等(1987)对郫县的多年观测结果进行了研究与分析,用数学线性化反演方法,基于郫县台的电性结构条件,对地电阻率随时间变化的实际观测资料进行了反演研究,得到了各层真电阻率随时间变化的计算结果。介质内部不同部位真电阻率随时间变化的结果通过反演的方法被解释出来,为分析和识别非震变化的影响和提取与地震有关的前兆信息提供了重要的手段。此前国内外虽然对不少地电阻率多极距观测实例进行了研究,但是,由于种种原因,没有一例开展了随时间变化的地电阻率观测资料向真电阻率时间变化的反演研究。
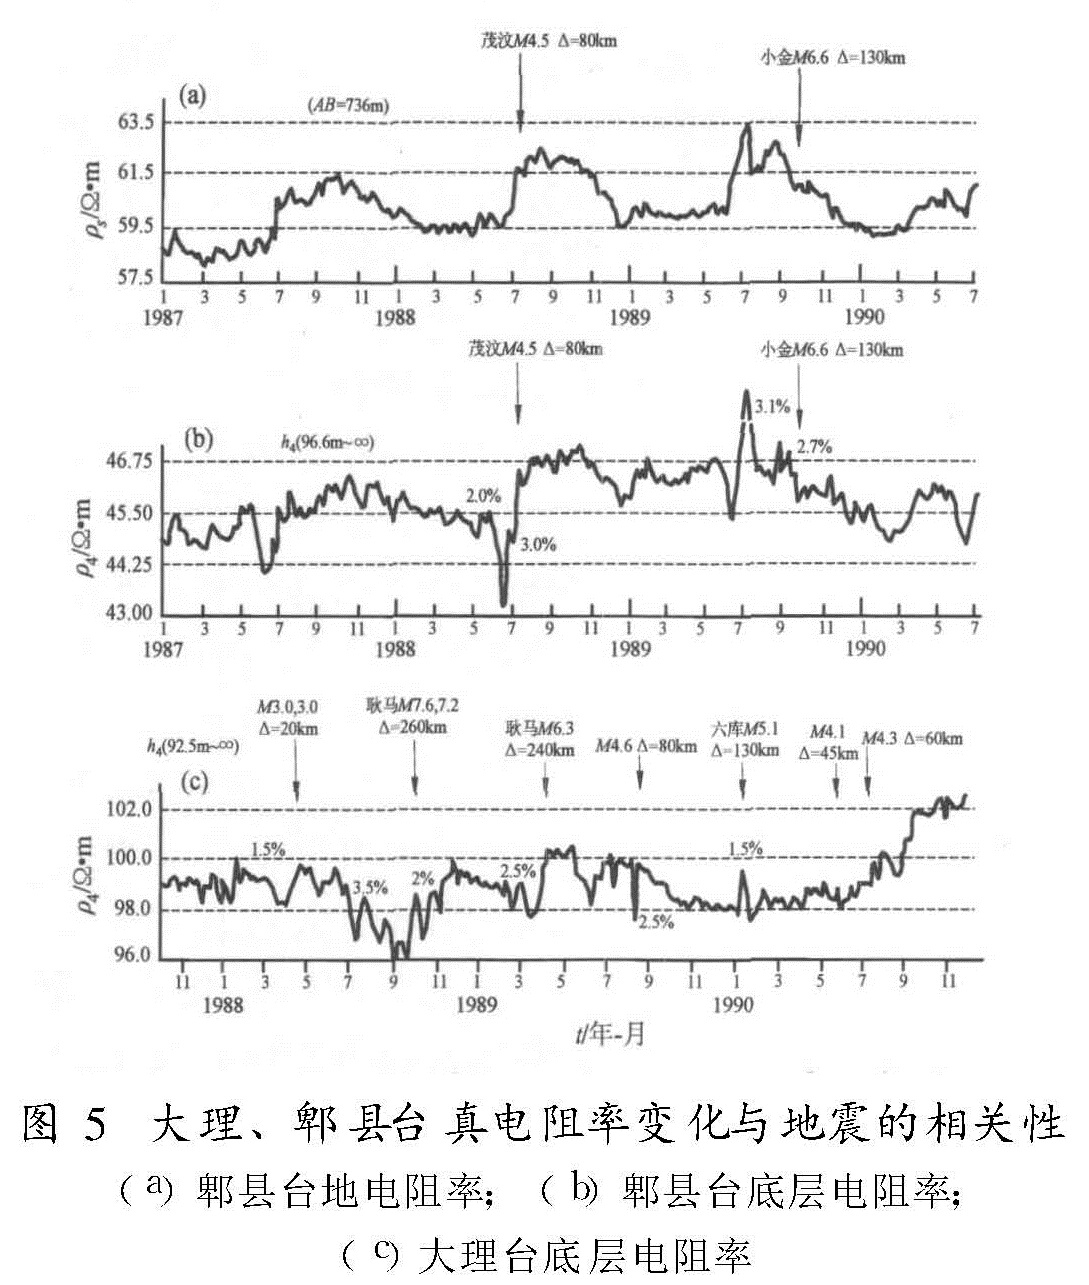
这项工作还相当好地解释了郫县台单极距地电阻率观测中发现的地电阻率年变化与地下水位同步升降的令人费解的现象。因为直观来看,水位增加表明水含量的增多,电阻率应当下降,所以地电阻率的升降与地下水位的升降似乎应当反向变化,才是可以理解的,因此有人将这类年变化定义为“反常年变化”。但是这项研究表明,郫县台的表层真电阻率的变化与地下水位的变化是反向的,这是真实的物理过程:水含量的增加或减少,是真电阻率变化下降或上升的物理原因,郫县台出现的地电阻率年变化并不是什么反常年变化,物理上它没有什么“反常”; 导致地电阻率年变化所谓反常的真实原因是,一个物理上正常的真电阻率年变化出现在一个特定的电性结构上,并且为一个具有特定装置参数的装置系统所观测。而后的研究(钱家栋等,1985; 赵和云等,1987)进一步表明,这种现象的出现,与该台具体结构参数和装置参数下表层真电阻率影响系数S1<0有关。对于AB=736 m的极距,算得:
(Δρs)/(ρs)=-0.187(Δρ1)/(ρ1)+0.290(Δρ2)/(ρ2)+0.897(Δρ3)/(ρ3);
对于AB=848 m的极距,算得:
(Δρs)/(ρs)=-0.119(Δρ1)/(ρ1)+0.167(Δρ2)/(ρ2)+0.952(Δρ3)/(ρ3).
在两种极距下,S1都为负值。同样,在无孕震时认为第二层、第三层的电阻率变化量很小,近似为零。这时,AB=736 m和AB=848 m时的ρs则由
(Δρs)/(ρs)=-0.187(Δρ1)/(ρ1)
和
(Δρs)/(ρs)=-0.119(Δρ1)/(ρ1)
分别计算。
薛顺章等(1994)、钱家栋(1993)还基于上述反演的结果探讨了地电阻率多极距反演结果在地震预测研究中的运用。图4b给出了应用反演后真电阻率随时间变化的多年结果(钱家栋,1993)。可以明显地看出,由于较好地“删除”了表层潜水水位升降造成的影响,底层真电阻率长期观测的结果与附近地震之间的相关性明显改善。
特别是在1989年9月22日发生的四川小金6.6级地震前,距离震中130 km的郫县台的第4层真电阻率震前出现明显的趋势异常和短期异常,幅度达4.5%。显然,这样的结果在受表层干扰严重的地电阻率曲线上是难于察觉的。
关于郫县台地电阻率反演问题,近年来卢军等(Lu等,2004)也作了研究,其结果大体相同。
2.3 云南大理等地震台的试验类似的多极距观测试验,还曾在云南大理台、甘肃平凉台(薛顺章等,1994)以及安徽嘉山台(汪雪泉等,2002)进行过。
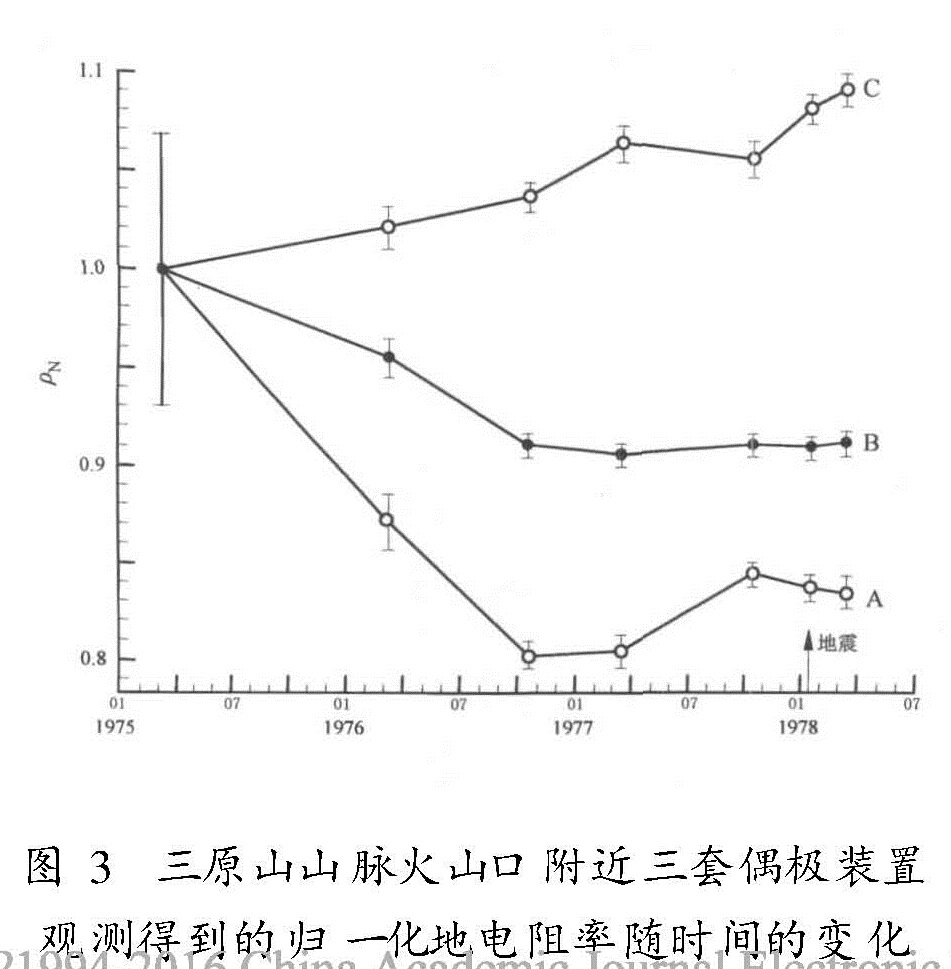
图5为薛顺章等(1994)对郫县台和大理台多极距观测反演的底层真电阻率变化的时程曲线与周围中强以上地震的相关性分析,有很强的说服力。而图5a、b与图4中郫县台地电阻率时程曲线形成了清晰的对照。
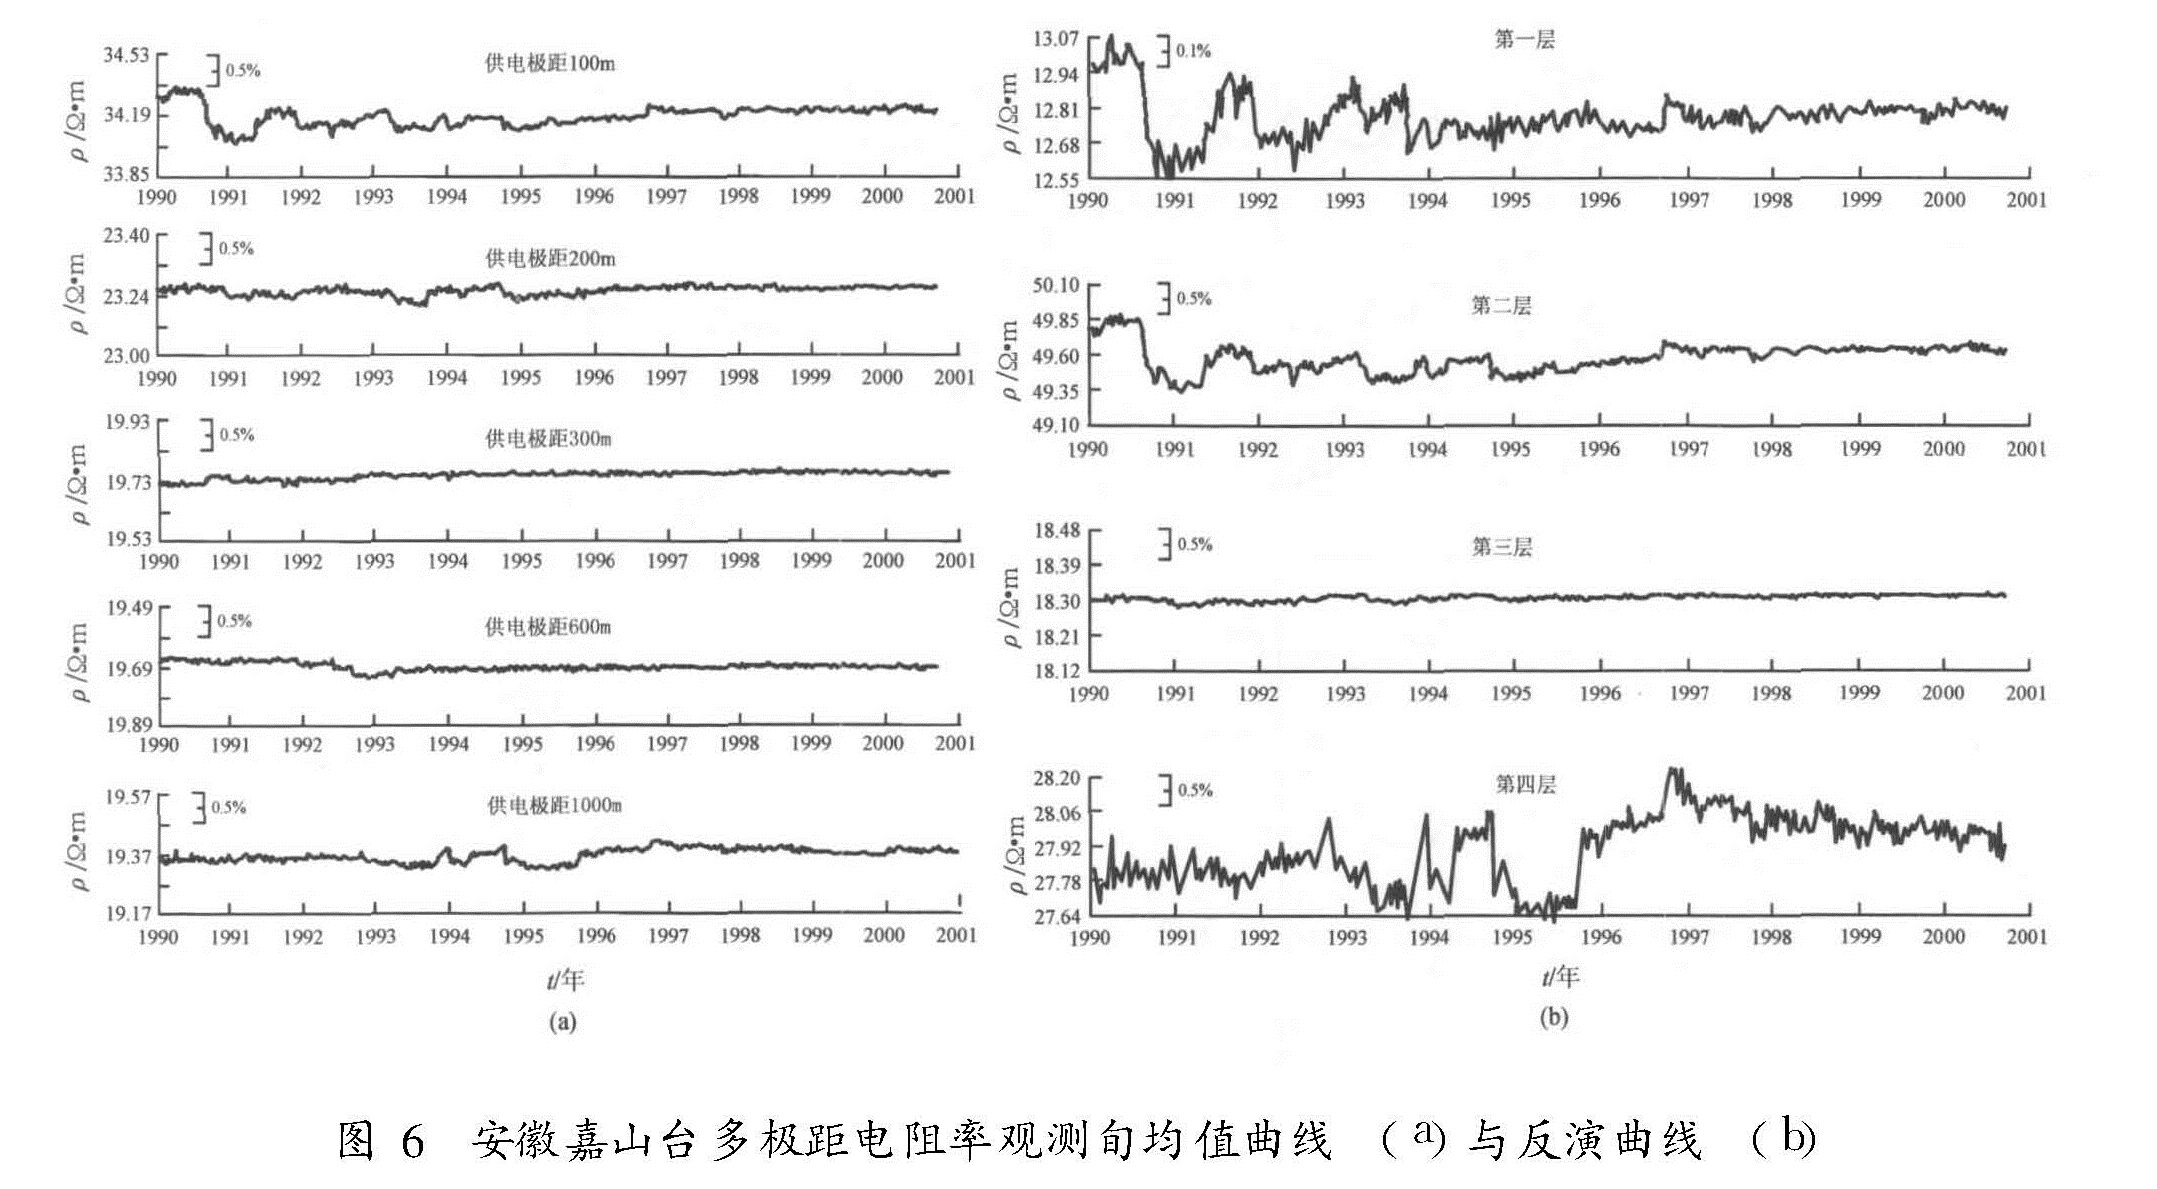
从安徽嘉山台多极距观测结果(图6a)(汪雪泉等,2002)可见,即使是同一地点同一方向,由于测线的极距不同,观测到的视电阻率也不同,这是由于不同极距条件下观测深度不同所致(汪雪泉等,2002)。供电极距为100 m的测线,测的是地下第二和第三层的电阻率,并以第二层为主; 供电极距为1 000 m的测线,测的是第三和第四层的电阻率,以第三层为主; 而其它供电极距的测线,测的大体是第三层的电阻率。从电阻率变化形态上看,供电极距为100 m的测线,其变化幅度
较大,供电极距为200 m和1 000 m的测线次之,而供电极距为300 m和600 m的测线测得的电阻率变化幅度最小。图6b是反演结果,很明显,第一层电阻率变化幅度最大,达到4%; 第二层变化幅度迅速减小,为1%; 第三层变化平稳,不到0.5%; 第四层上下波动,变幅达到2%。 究其原因,第一层厚
不到2 m,属耕作层,受气象、灌溉因素干扰较大,故电阻率变化也大; 第二层厚约20 m,埋深在2 m之下,受气温、降雨影响较少,因此其电阻率变化也小; 第三层厚300多米,距地表20多米,基本上不受外界因素影响,电阻率数值非常稳定; 第四层电阻率虽然上下波动较大,但其均值没变化。电阻率波动较大,可能与计算模型中该层厚度为无穷大有关,具体原因还有待进一步研究。2.4 宝坻台高密度电法观测试验以上观测试验类似于台站用四级对称的方法开展的多极距观测试验。“八五”期间,冯锐等(2001)利用近年在物探领域中发展起来的新技术——高密度电法,也开展了定点观测随时间变化的研究试验。试验装置位置保持固定,每3个月测定一次,根据高密度电法的反演方法获取介质真电阻率随时间的变化。这个方法的特点是,采用二维模型作为研究对象。图7是他们的观测结果,展示了宝坻台试验观测期间,真电阻率变化与附近一次3级左右地震的关系,是一次有益的探索。然而观测系统所显示的真电阻率变化区域主要在浅部,因此观测系统的稳定性可能是其中值得研究的问题。
3 结语
上述这些把地电阻率多极距观测方法从物探电法中引用进来的国内外实践,是地震预测研究中移植物探电法的重要尝试。在物探电法中,多极距观测系统要解决的问题是介质电学性质的空间分布问题,对于测深方法而言,就是要解决介质电学性质随深度分布的问题。在地震预测研究中,孕震过程的影响可能使介质的电学性质发生变化,所以实际上我们需要研究介质电学性质随时间变化的过程及其与孕震过程的关系。因此,如同物探电法中单一极距不能认识介质电学性质随深度的变化一样,在地震预测研究中,凭借单一极距的地电阻率观测随时间的变化也不能认识不同深度上的介质电学性质随深度的变化,特别是当人们在实践中逐步认识到不同深度的介质的真电阻率变化可能是由不同的物理原因(如地下水的升降变化引起的表层电阻率变化)引起的,其机制多半与地震的孕震过程无关而必须对其加以区分时,地电阻率多极距观测方法的应用与研究就成为必然的了。
近年来随着观测技术和计算技术的进步,和地震预测从经验预报或统计预报向物理预报发展的需求,多极距观测系统的建立和反演技术的应用将会受到越来越多的重视。但实际介质结构的复杂性将使反演技术面临许多挑战,甚至是严峻的挑战。另外,在进行地电阻率反演研究时,还应考虑地球物理反演结果的不唯一性,这也许正是多年来,尽管人们追求物理预测,但却不能将其迅速推进的原因之一。在这种情况下,加强实践,不断完善反演技术和方法就显得十分重要。
- 巴尔苏可夫.1989.岩石导电率与地震[C]//钱家栋,陈有发.地震地电学译文集.北京:地震出版社:297-304.
- 冯锐,郝锦绮,周建国.2001.地震监测中的电阻率层析技术[J].地球物理学报,44(6):833-842.
- 钱家栋,陈有发,金安忠.1985.地电阻率方法在地震预报中的应用[M].北京:地震出版社.
- 钱家栋.1993.与大地震有关的地电阻率变化研究[J].中国地震,9(4):341-350.
- 汪雪泉,郑兆苾,薛维龙.2002.安徽嘉山台的多极距电阻率观测[J].地震学刊,22(1):1-4.
- 行武毅,吉野登志男,哥田九司.1980.大岛火山三原山火山口周围的电阻率变化和1978年伊豆大岛近海地震[R].东京:东京大学地震研究所汇报(第53号第3-4册):961-969.
- 薛顺章,温新民.1994.地电阻率预报地震新方法研究[J].地震学报,16(2):227-234.
- 赵和云,钱家栋.1987.郫县台多极距观测资料的反演和分析[J].中国地震,2(增刊):74-78.
- Lu J,Xue S Z,Qian F Y,et al.2004.Unexpected changes in resistivity monitoring for earthquakes of the Longmen Shan in Sichuan,China,with a fixed Schlumberger sounding array[J].Physics of the Earth and Planetary Interiors,145:87-97.
- Mazzella A,Morrison F H.1974.Electrical Resistivity Variations Associated with Earthquakes on the San Andreas Fault[J].Science,185(4154):846-855.