基金项目:福建省地震局科研基金和厦门市科技局社会发展创新项目(3502z20074037)联合资助.
(福建省地震局厦门地震台, 福建 厦门 361003)
(Seismic Station of Xiamen,Earthquake Administration of Fujian Province,Xiamen 361003,Fujian,China)
monitoring scope; ground deformation; earthquake anomaly; distortion of curve; stagger of curve; Xiamen seismic station
备注
基金项目:福建省地震局科研基金和厦门市科技局社会发展创新项目(3502z20074037)联合资助.
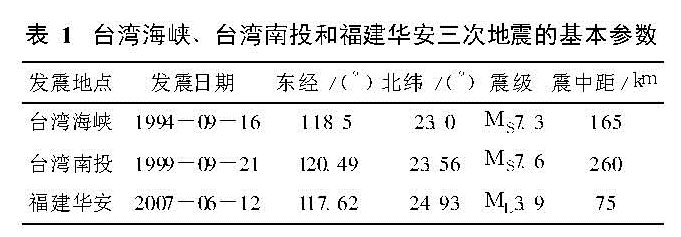
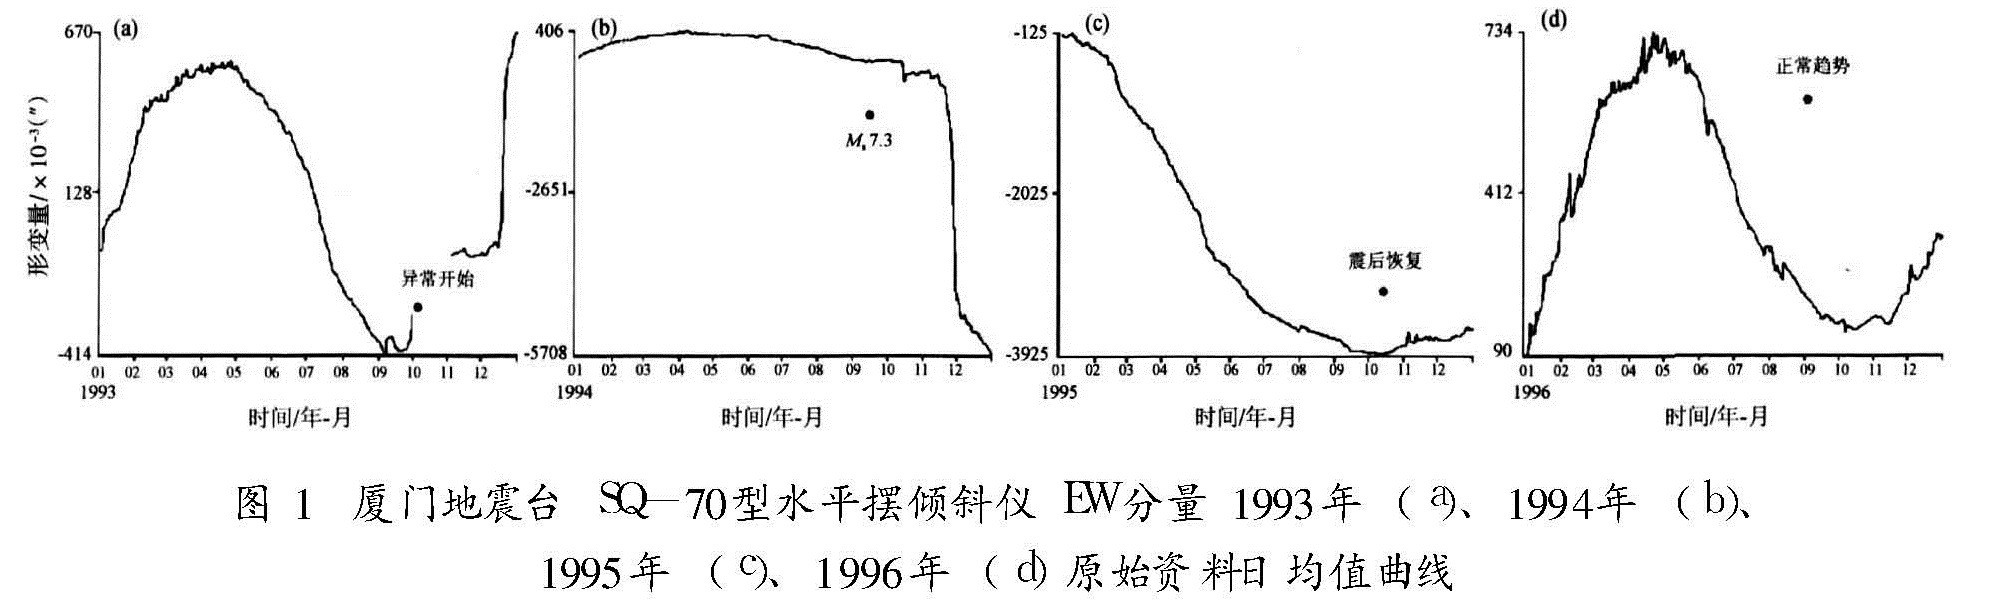
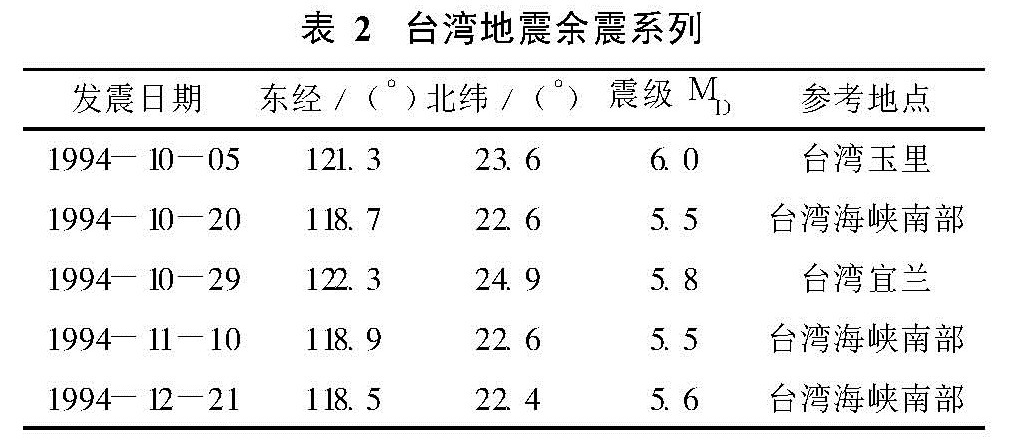
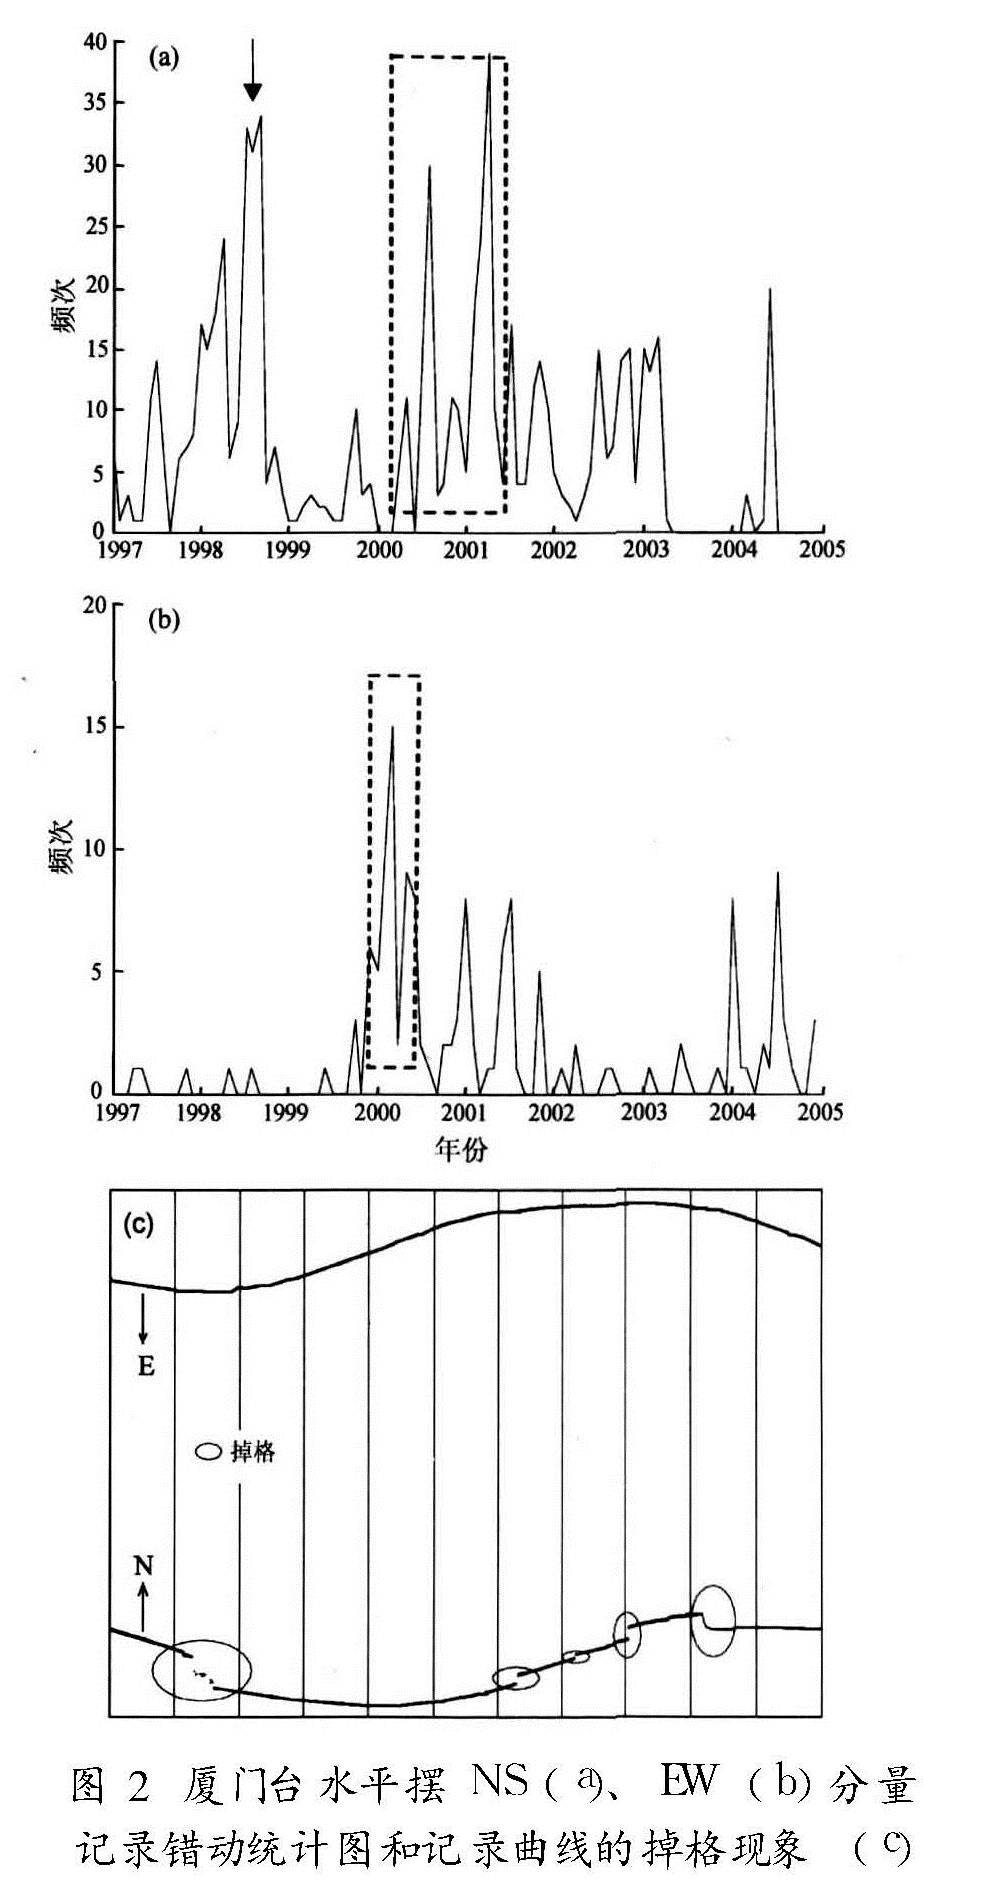
分析了发生在厦门地震台周边的三次地震在地形变仪器上的不同反映,探讨了倾斜仪与伸缩仪对同一地震的监测能力的差别。结果 表明:① 同一异常并非在所有的仪器上都能表现出来,即使在同一观测仪器的不同分量上也会有不同的表现; ② 不同的地震在同一仪器上表现出来的异常是不同的,厦门地震台水平摆的异常形式有两种——日均值曲线畸变与记录曲线错动; ③ 仪器的监测范围与未来震级的大小有关系。
We analyze the records of three earthquakes around the Xiamen seismic station of Fujian observed by the ground deformation seismograph at the station,and discuss the ability that the tilter and tensometer monitor the same earthquake.The results are as follows:① Not every instrument can show anomaly,and the same anomaly may have different performance even on the different components of an instrument.② The abnormal performance on the same instrument varies with earthquakes.The anomalies recorded by the level pendulum tilter have two kinds of shapes:the distortion of daily mean curve and the stagger of raw recording curve.③ The monitoring scope of equipment is related to the size of the magnitude of earthquake.
引言
据笔者多年的观测数据统计,厦门地震台地形变仪器各测项每年记录到的可识别的地震平均为105次左右,在地震活跃期记录到的地震更多,但这并不意味着这些地震都已经被该形变仪监测到。众所周知,仪器的映震能力与监测能力是两个不同的概念。简单地说,映震能力是指地震仪器对地震的反映能力,主要是在地震发生之后,地震波能不能被该仪器记录到; 而监测能力是指在地震发生之前,该地震所产生的前兆能否被仪器记录到。相比之下,后者才是衡量一台前兆地震仪器好坏的重要标准之一,也是用前兆仪器开展地震监测的意义所在。厦门地震台自开展地形变观测以来,明显记录到了两次地震的地形变前兆。震后总结经验教训时,大家认为这两次地震被成功地监测到,但没有被预报,还有一次地震虽然谈不上有前兆意义,但它的发生的确影响了原始观测曲线的趋势,因此具有特殊的地震形变前兆特征和地震预测意义。这三次地震分别是:① 1994年9月16日台湾海峡7.3级地震; ② 1999年9月21日台湾南投7.6级地震; ③ 2007年6月12日福建漳州华安3.9级地震。它们的基本参数分别见表1。虽然这三次地震在时间与空间上相差较大,但其前兆异常在厦门台不同形变监测仪器上有着不同的表现,这对我们在以后的监测预报工作中能起到一定的借鉴作用。
发震地点 发震日期 东经/(°)北纬/(°)震级 震中距/km台湾海峡 1994-09-16 118.5 23.0 MS7.3 165台湾南投 1999-09-21 120.49 23.56 MS7.6 260福建华安 2007-06-12 117.62 24.93 ML3.9 75
1 三次地震的前兆特征
(1)台湾海峡地震的前兆特征是SQ-70型水平摆倾斜仪EW分量日均值曲线发生严重畸变(图1)。由图1可以看出,该地震的前兆异常实际上始于1993年10月,按照往年的固体潮年变规律,此时曲线应该是呈上升的趋势而非实际上的平缓,到年底时,曲线又加速急剧东倾,不到10天时间,东倾幅度接近0.6″(图1a),之后曲线就一直保持高位平缓的态势直到1994年9月16日地震的发生,紧接着在两个月左右的时间内,又发生了多次余震(表2),这时曲线由高位平缓的态势急剧下降(图1b)。约一年后,年变规律才逐步恢复正常(图1c,d),明显的前兆异常淹没了固体潮年变规律。由于NS分量受海潮干扰大于EW分量,因此其日均值异常不明显。
(2)台湾南投地震的前兆特征是水平摆NS分量模拟记录中错动(俗称掉格)次数明显增多(图2a)。图中有两处明显的错动异常,一是从1999初开始,错动次数就逐月上升,到了当年的6月,错动突然减少,处于相对平静状态,从7月底开始错动又急剧增多,直到地震发生,如图中箭头所指区域; 另一处是2001年初的错动异常,该异常在两个分量上都有表现(2a,b中的虚线矩形框),笔者认为异常对应的是2001年11月14日昆仑山口西8.1级巨震,反映了我国大陆整体地震活动水平正处于自上个世纪来的第五个地震活跃期(王武星等,2007; 孙加林和章瑞,2007)。虽然该地震的震中离厦门台达数千千米,但由于震级太大,其前兆异常(如慢地震形式)有可能会在厦门台水平摆倾斜仪的原始记录图上有所体现。图2c为1999年7月30日该分量的原始记录图在一天之中发生多次错动的情况。该地震发生后,曲线的错动次数明显下降至最低水平。该异常并没有在EW分量上显示出来(图2c)。
(3)厦门台伸缩仪NS分量原始日均值曲线的趋势异常。在2006年8月以前,仪器记录曲线的规律性较好,年变正常,但自8月份以后,趋势变化出现异常,我们认为这可能与2006年年底我国南海发生的一系列地震有关,但南海地震发生后曲线压缩趋势仍然在继续,异常依旧存在,原因不明。2007年6月12日福建漳州华安地震的发生,曾一度(约半个月时间)缓解了厦门台伸缩
仪NS分量原始日均值曲线下降的趋势(图3)。但从7月初开始,这种下降的趋势仍然在继续,由此可见,这种趋势异常对应的并非华安地震,而是另有原因。华安地震震级虽小,但它离厦门台较近,故其影响是不能忽视的,它的发生只是在大的压缩背景下使地下应变得到暂时的缓和。约半个月过后,NS分量曲线又开始处于压缩状态,并且下降的速度也和以前的相差不多。据了解,在仪器西南方向约300 m处,正在修建一幢20多层的高楼,其开工日期与仪器发生趋势异常的时间较为吻合,故笔者认为该趋势异常有可能是由修建大楼引起的。2 倾斜仪和伸缩仪监测对象的对比分析
由于观测的物理量不同,水平摆倾斜仪与石英伸缩仪接收到来自地下和地表的信息也不完全一样。洞体应变的观测对象是地表的面应变,反映的是地表某一平面上(一般为水平面)的局部地壳形变的信息,从它的观测资料中不可能得到地下乃至震源处的主应变的方向及大小; 地倾斜的观测对象是瞬时地表面相对某一参照面(一般为水平面)的倾斜角度,具有剪应变的性质(刘序俨等,2005),它所反映的是地表某一点垂直方向上的局部地壳形变信息。由于仪器置于地表,它就不可避免地要受到来自地表的各种非震因素的干扰。从某种意义上说,这种干扰信息要远远大于来自地下的构造信息。下面,我们以负荷形式的干扰为例来讨论倾斜仪与洞体应变仪监测量级上的差别。实际上,来自地表的干扰大多也是以这种形式作用于仪器的,如海潮的干扰。
由弹性理论(杜庆华,1986; 冯锐,1978)可知,半无限体边界上有一个垂直于边界的集中力P时,其相应的位移解为
μr=P/(4πER)[(rz)/(R2)-((1-2γ)r)/(R+z)],
μθ=0,
μz=P/(4πER)[2(1-γ)+(z2)/(R2)].(1)
式中R2=z2+r2=z2+x2+y2,P为集中在一点的作用力,E为介质的弹性模量,γ为介质的泊松比。
垂直方向的位移在水平x、y方向所引起的地倾斜分别为
Φx=(μz)/(x)=-P/(4πE(x2+y2+z2)1/2)[(3xz2)/((x2+y2+z2)2)+(2x(1-γ))/(x2+y2+z2)],
Φy=(μz)/(y)=-P/(4πE(x2+y2+z2)1/2)[(3xz2)/((x2+y2+z2)2)+(2y(1-γ))/(x2+y2+z2)].(2)
当观测点位于地表时,z=0,则上式简化为
Φx〖JB<1*|〗z=0=(μz)/(x)〖JB<2*|〗z=0=-(P(1-γ))/(2πE(x2+y2))x/((x2+y2)1/2),
Φy〖JB<1*|〗z=0=(μz)/(y)〖JB<2*|〗z=0=-(P(1-γ))/(2πE(x2+y2))y/((x2+y2)1/2).(3)
水平方向的位移在水平x、y方向所引起的线应变分别为
εx=(μr)/(x)=P/(4πE)[(xz)/((x2+y2)1/2((x2+y2+z2)3)1/2)-(3xz(x2+y2)1/2)/(((x2+y2+z2)5)1/2)]
+P/(4πE)[((1-2γ)x(x2+y2)1/2)/((x2+y2+z2)(z+(x2+y2+z2)1/2)2)]-P/(4πE)[((1-2γ)x)/((z+(x2+y2+z2)1/2)(x2+y2)1/2(x2+y2+z2)1/2)]
-P/(4πE)[((1-2γ)x(x2+y2)1/2)/((z+(x2+y2+z2)1/2)((x2+y2+z2)3)1/2)],(4)
εy=(μr)/(y)=P/(4πE)[(yz)/((x2+y2)1/2((x2+y2+z2)3)1/2)-(3yz(x2+y2)1/2)/(((x2+y2+z2)5)1/2)]
+P/(4πE)[((1-2γ)y(x2+y2)1/2)/((x2+y2+z2)(z+(x2+y2+z2)1/2)2)]-P/(4πE)[((1-2γ)y)/((z+(x2+y2+z2)1/2)(x2+y2)1/2(x2+y2+z2)1/2)]
-P/(4πE)[((1-2γ)y(x2+y2)1/2)/((z+(x2+y2+z2)1/2)((x2+y2+z2)3)1/2)],(5)
当观测点位于地表时,z=0,则(4)、(5)式分别简化为
εx〖JB<1*|〗z=0=(μz)/(x)〖JB<2*|〗z=0=-P/(4πE)((1-2γ)x)/((x2+y2)(((x2+y2))1/2),(6)
εy〖JB<1*|〗z=0=(μz)/(y)〖JB<2*|〗z=0=-P/(4πE)((1-2γ)y)/((x2+y2)(((x2+y2))1/2).(7)
由(3)、(6)、(7)式得
(εx〖JB<1*|〗z=0)/(Φx〖JB<1*|〗z=0)=(εy〖JB<1*|〗z=0)/(Φy〖JB<1*|〗z=0)=(1-2γ)/(2(1-γ)).(8)
如果取厦门地区岩石的泊松比实测值为0.232 06,代入上式计算,得计算结果是0.348 91。这就说明同一负荷干扰源对位于同一地点的洞体应变仪与倾斜仪在量级上的影响是不一样的,对洞体应变仪的干扰约为对地倾斜仪干扰的三分之一,换句话说,如果未来地震的孕震模式是以负荷形式进行的话,在不考虑其它因素的情况下,则地倾斜仪的监测能力大约是洞体应变仪的三倍。也就是说,如果有负荷形式的干扰或地震异常,则该现象首先会在地倾斜仪上表现出来。
3 结论与讨论
地形变仪器的监测能力是有限的,针对不同观测对象,地形变仪器的监测范围也不尽相同。有关资料表明,在现有地震监测水平的状况下,厦门台地倾斜仪的最大监测范围应为200 km左右,而映震能力则远远大于此范围(熊先保等,2000); 洞体应变仪的监测范围可能会更大些。仪器的监测能力是一个相当复杂的问题,它取决于仪器观测的综合噪声水平,而综合噪声水平又取决于仪器本身和环境条件两个方面。综合噪声水平越低,仪器观测精度越高,监测前兆信息的能力就越高,监测的范围也就越大(张国民等,2001)。同时,仪器的监测范围也和未来地震的震级有很大的关系,震级越大,释放的能量越多,地震的前兆信息量也会越多。一般说来,被仪器监测到的前兆信息能量约在主震释放的能量的百分之十以内。
(1)根据长期的观测经验,地形变监测仪器上可能会表现出来很多种地震异常(包括通过数学方法演变出来的各种异常指标),但最直接、最直观的异常还是在原始观测数据的日均值、五日均值曲线以及原始记录图上。
(2)由于观测对象的不同,同一异常(包括干扰异常)并非在所有的监测仪器上都能明显地体现出来,厦门台伸缩仪NS分量的趋势异常在倾斜类仪器上就体现得不明显。
(3)由于地下介质的非均匀性及各向异性,以及环境干扰的方向性等,同一异常在同一观测仪器的不同分量上也会有所不同体现。以厦门台水平摆倾斜仪为例,由于其NS分量受到的海潮干扰远大于EW分量的,故台湾海峡地震引起的趋势异常在EW分量就表现得十分明显,而在NS分量上就不明显。
(4)地震异常一般不会以相同的形式在同一监测仪器上重复。如1994年9月16日海峡地震表现出来的异常是水平摆EW分量的日均值趋势异常(也有错动异常),而1999年9月21日台湾南投地震所表现出来的异常是水平摆NS分量原始记录图上的错动异常(日均值趋势异常不明显),2001年11月14日昆仑山口西特大地震在水平摆NS、EW分量原始记录图上都有错动异常(但日均值趋势异常不明显)。
(5)厦门台地形变仪器的监测范围至少与两个因素有关,一是仪器的监测能力; 二是未来地震震级的大小。一般来说,5级左右的地震,监测范围约为200 km,震级越大,监测范围也越大,甚至能达到上千千米。
(6)通过对倾斜仪与伸缩仪监测对象的分析可知,同一负荷式的干扰或地震异常首先会在地倾斜仪上表现出来。
(7)随着对前兆异常现象研究的深入,一种新的异常指标正逐渐引起人们的重视,这就是被地震学者称为“低频前驱波”、“异常脉动”等的长周期事件,如图2c中的错动(掉格)现象,一天之中发生了如此之多的错动是在地震平静期内几乎没有的,这种错动实际上就是倾斜仪所表现出来的慢地震现象,它的出现是反映了当地地下介质结构的活动水平,还是预示着地震场兆的前兆异常,还需做进一步研究。
- 杜庆华.1986.弹性理论[M].北京:科学出版社.
- 冯锐.1978.地倾斜与地震[M].北京:地震出版社.
- 刘序俨,傅再扬,吴绍祖.2005.地面倾斜的形变特征及计算方法[J].大地测量与地球动力学,25(1):61-64.
- 孙加林,章瑞.2007.中国大陆20世纪以来第五地震活跃期的复杂性及其本质问题[J].地震,27(2):30-40.
- 王武星,马丽,黄建平.2007.强地震前后重力观测中异常变化现象的研究[J].地震,27(2):53-63.
- 张国民,傅征祥,桂夑泰,等.2001.地震预报引论[M].北京:科学出版社.