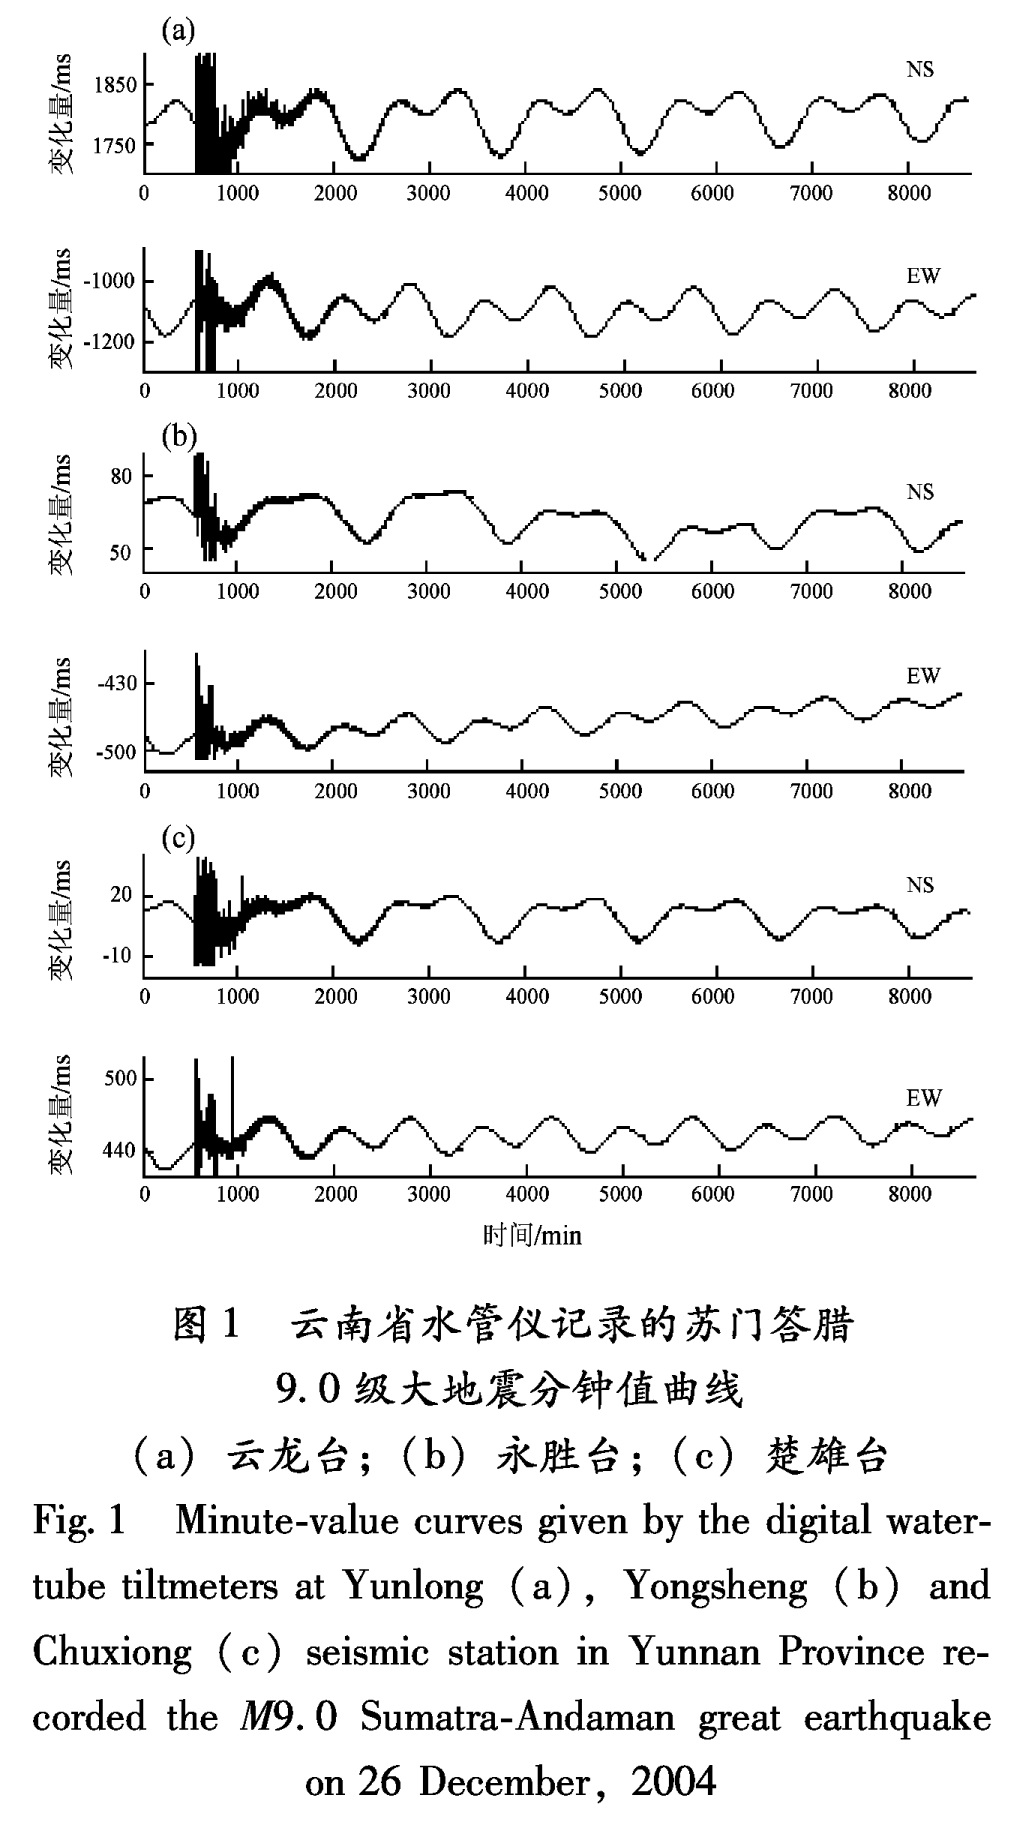
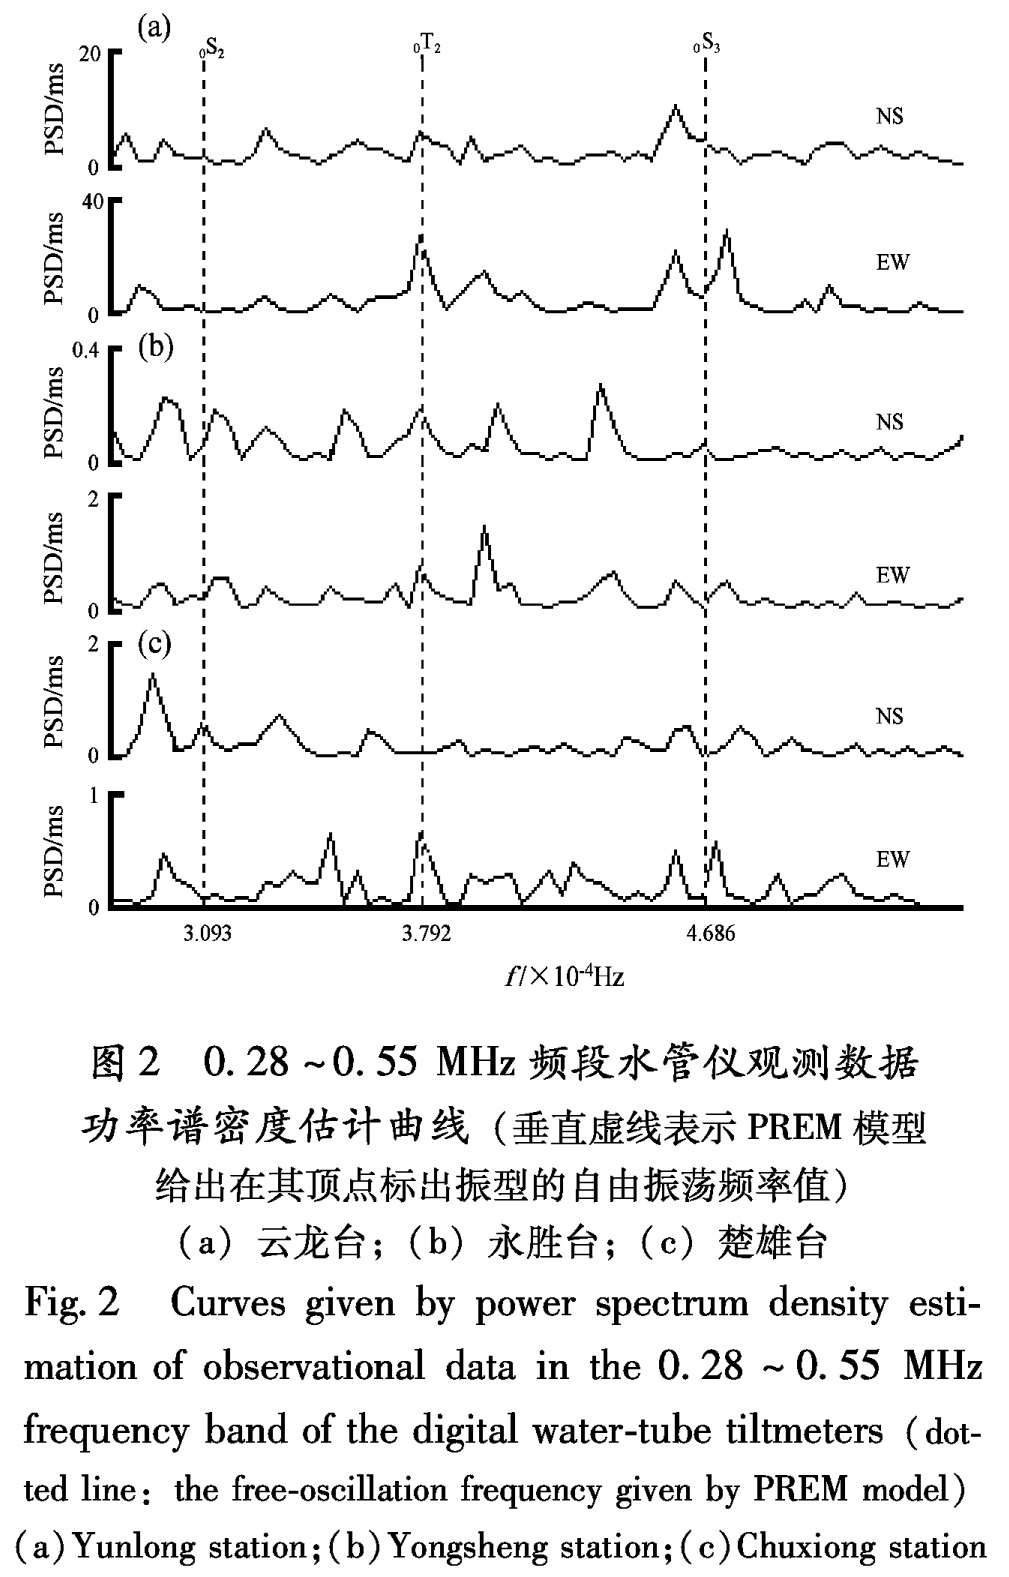
按照前面的计算方法,我们得到了云龙台、永胜台和楚雄台水管仪双向记录的功率谱密度估计(图2~6)。图2为0.28~0.55 MHz频段的功率谱密度估计,在这一频段可以看到,虽然0S2、0S3、0T2振型附近的功率谱密度有一个峰值,但相对于周围的噪声水平并没有明显分开。通常在低频段地球自由振荡振型不易从噪声中予以区分(雷湘鄂等,2002)。
图2 0.28~0.55 MHz频段水管仪观测数据功率谱密度估计曲线(垂直虚线表示PREM模型给出在其顶点标出振型的自由振荡频率值)
(a)云龙台;(b)永胜台;(c)楚雄台
Fig.2 Curves given by power spectrum density estimation of observational data in the 0.28~0.55 MHz frequency band of the digital water-tube tiltmeters(dotted line:the free-oscillation frequency given by PREM model)(a)Yunlong station;(b)Yongsheng station;(c)Chuxiong station
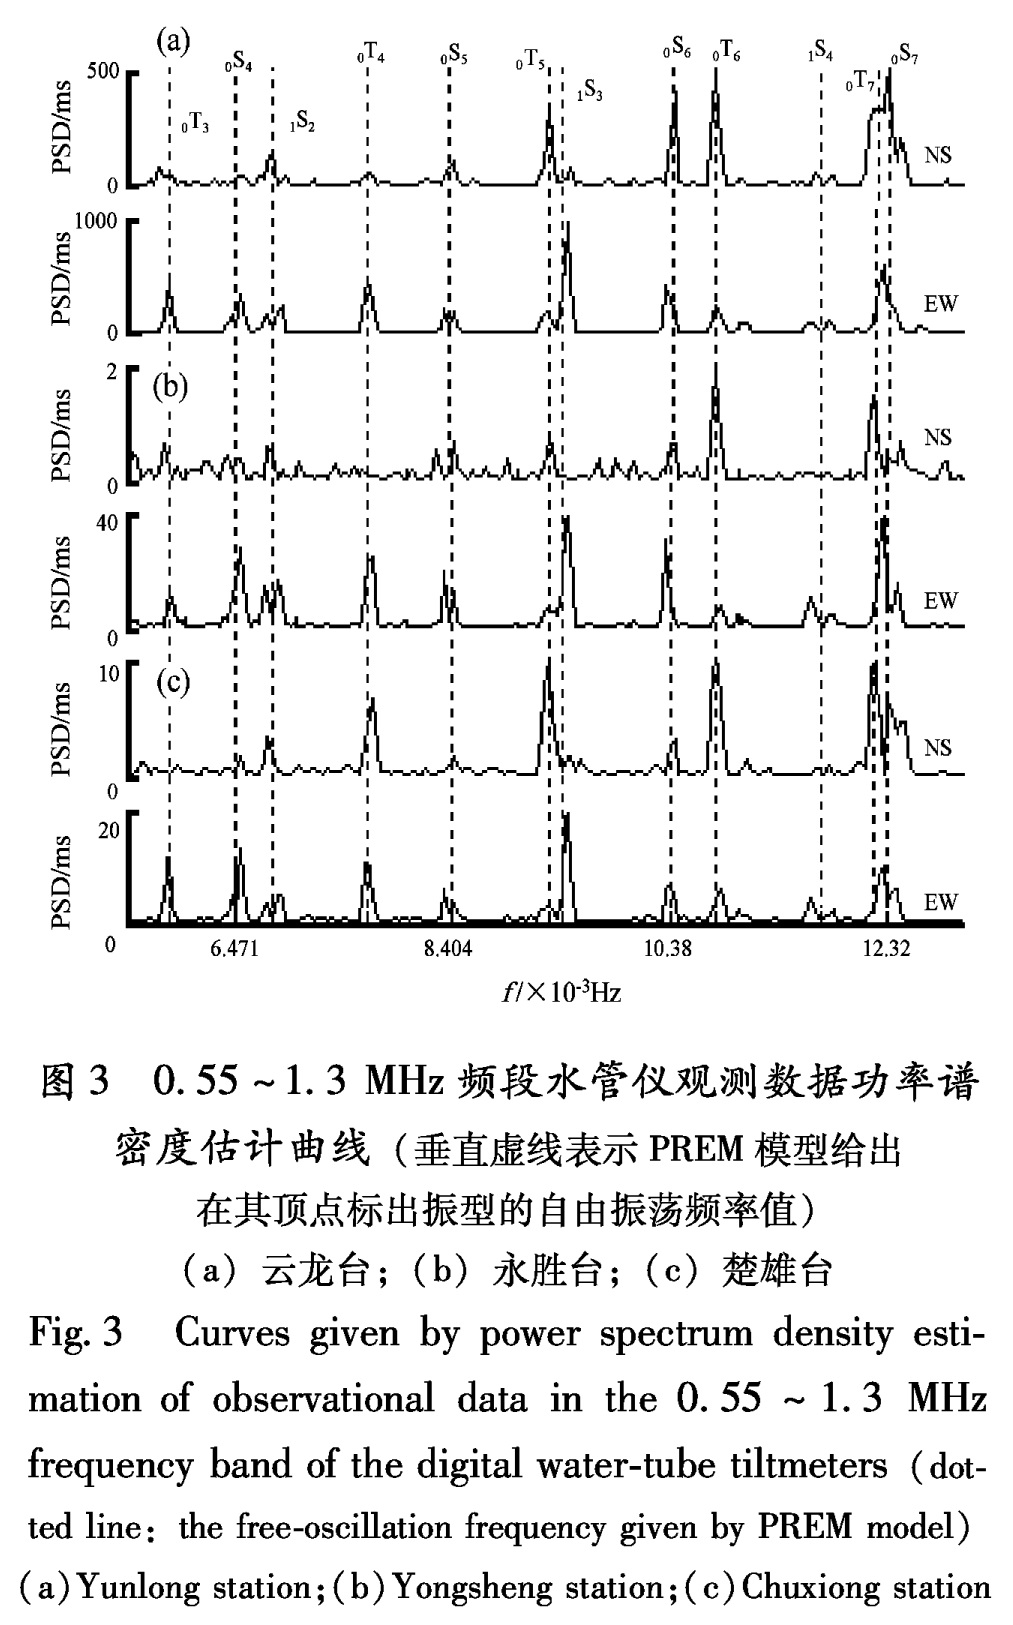
图3、
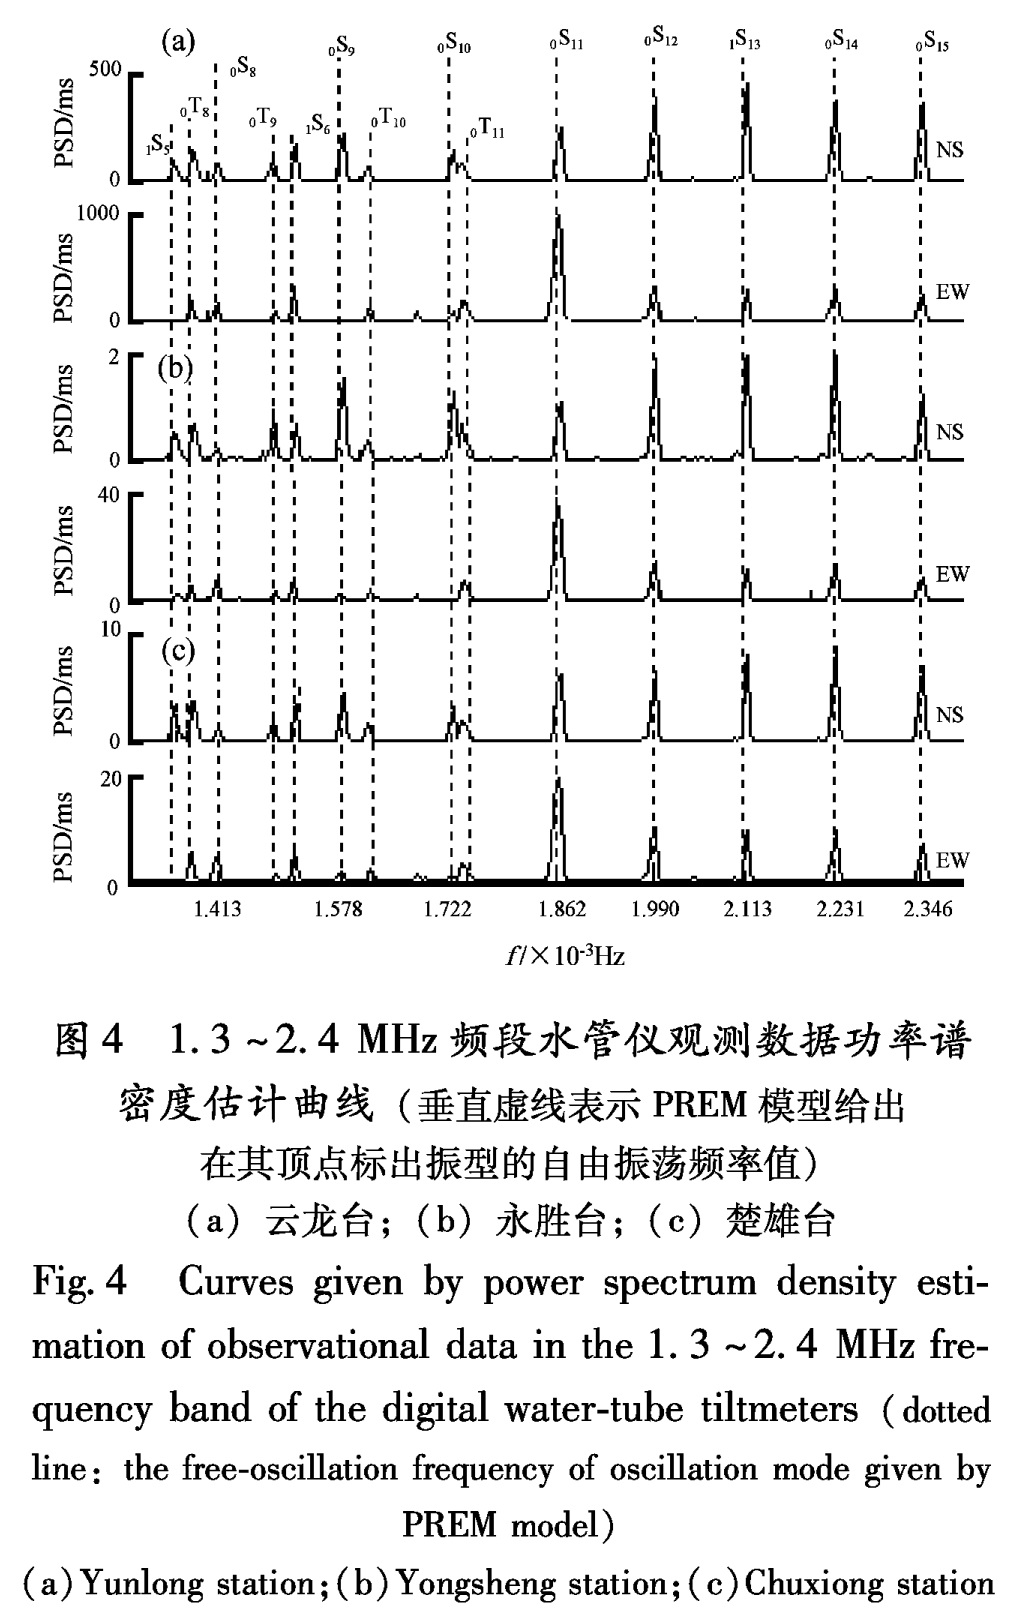
图4为0.55~2.4 MHz频段的功率谱密度(相对值)与PREM模型给出的球型振荡频率值的对应情况。在这一频段,云龙台、永胜台、楚雄台 水管仪双向的观测数据可以清楚地检测到球型振荡的基型振荡
0S
4、
0S
5、
0S
6、
0S
7、
0S
8、
0S
9、
0S
10、
0S
11、
0S
12、
0S13、
0S
14、
0S
15,同时,还检测到谐频球型振荡
1S
2、
1S
3、
1S
4、
1S
5、
1S
6和环型振荡
0T
3、
0T
4、
0T
5、
0T
6、
0T
7、
0T
8、
0T
9、
0T
10、
0T
11。
图3 0.55~1.3 MHz频段水管仪观测数据功率谱密度估计曲线(垂直虚线表示PREM模型给出在其顶点标出振型的自由振荡频率值)
(a)云龙台;(b)永胜台;(c)楚雄台
Fig.3 Curves given by power spectrum density estimation of observational data in the 0.55~1.3 MHz frequency band of the digital water-tube tiltmeters(dotted line:the free-oscillation frequency given by PREM model)(a)Yunlong station;(b)Yongsheng station;(c)Chuxiong station
图4 1.3~2.4 MHz频段水管仪观测数据功率谱密度估计曲线(垂直虚线表示PREM模型给出在其顶点标出振型的自由振荡频率值)
(a)云龙台;(b)永胜台;(c)楚雄台
Fig.4 Curves given by power spectrum density estimation of observational data in the 1.3~2.4 MHz frequency band of the digital water-tube tiltmeters(dotted line:the free-oscillation frequency of oscillation mode given by PREM model)(a)Yunlong station;(b)Yongsheng station;(c)Chuxiong station
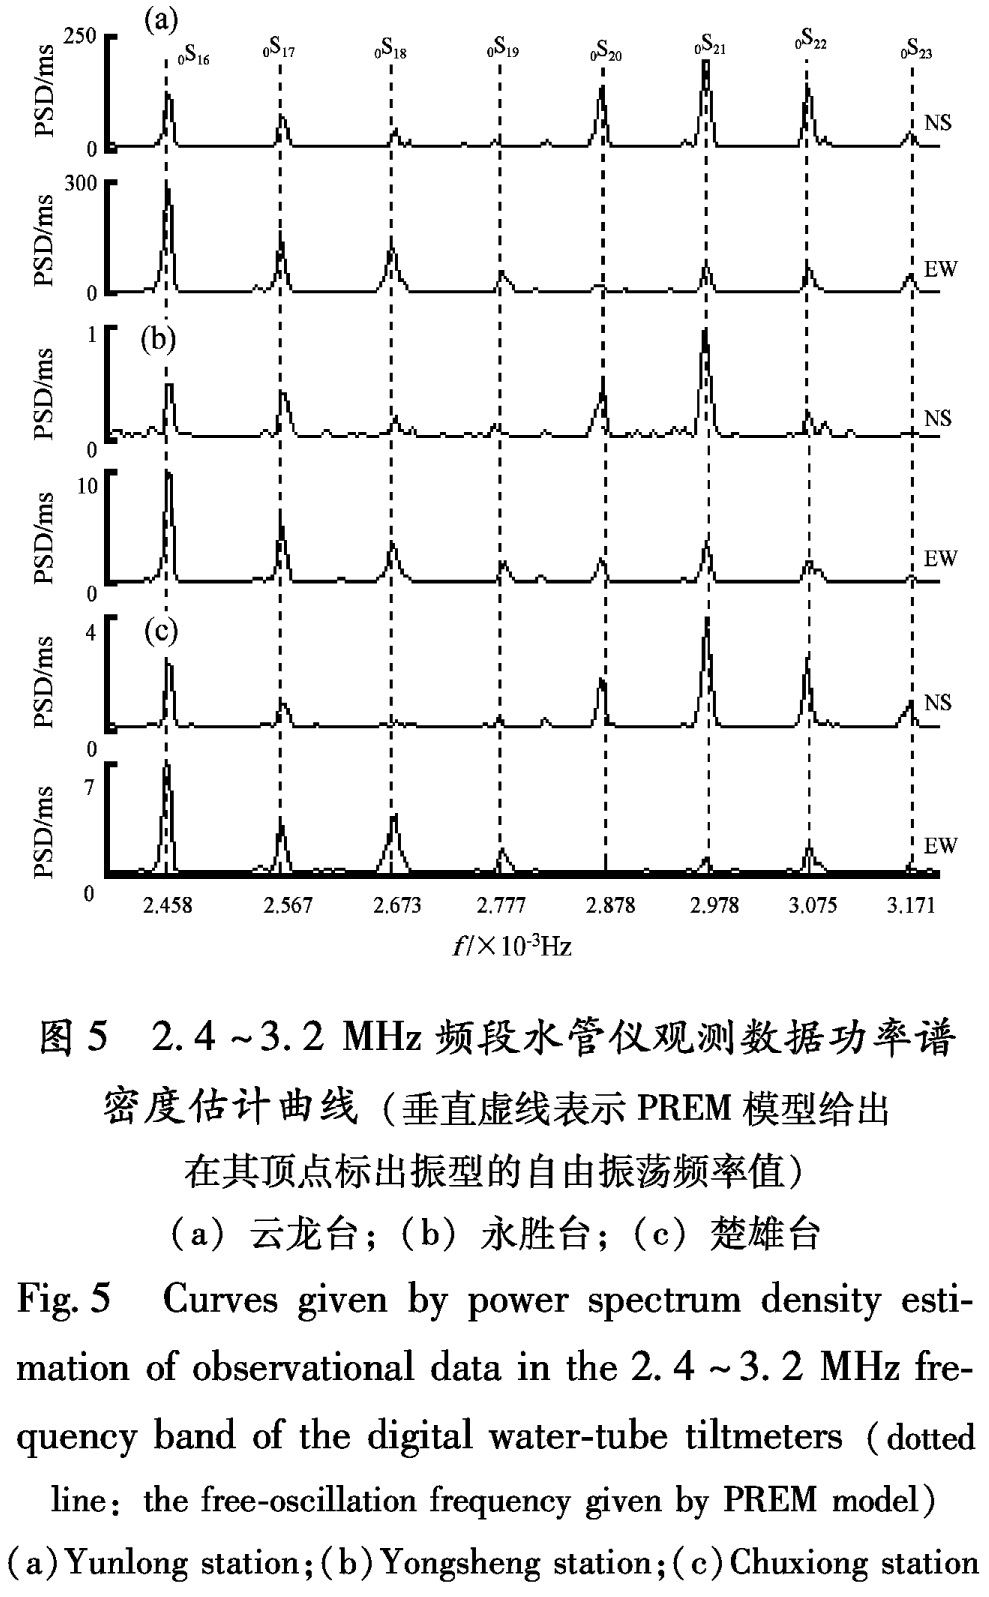
图5为2.4~3.2 MHz频段的功率谱密度(相对值)与PREM模型给出的球型振荡频率值的对应情况。可以看出3个台站均能清楚地检测出0S16~0S23。
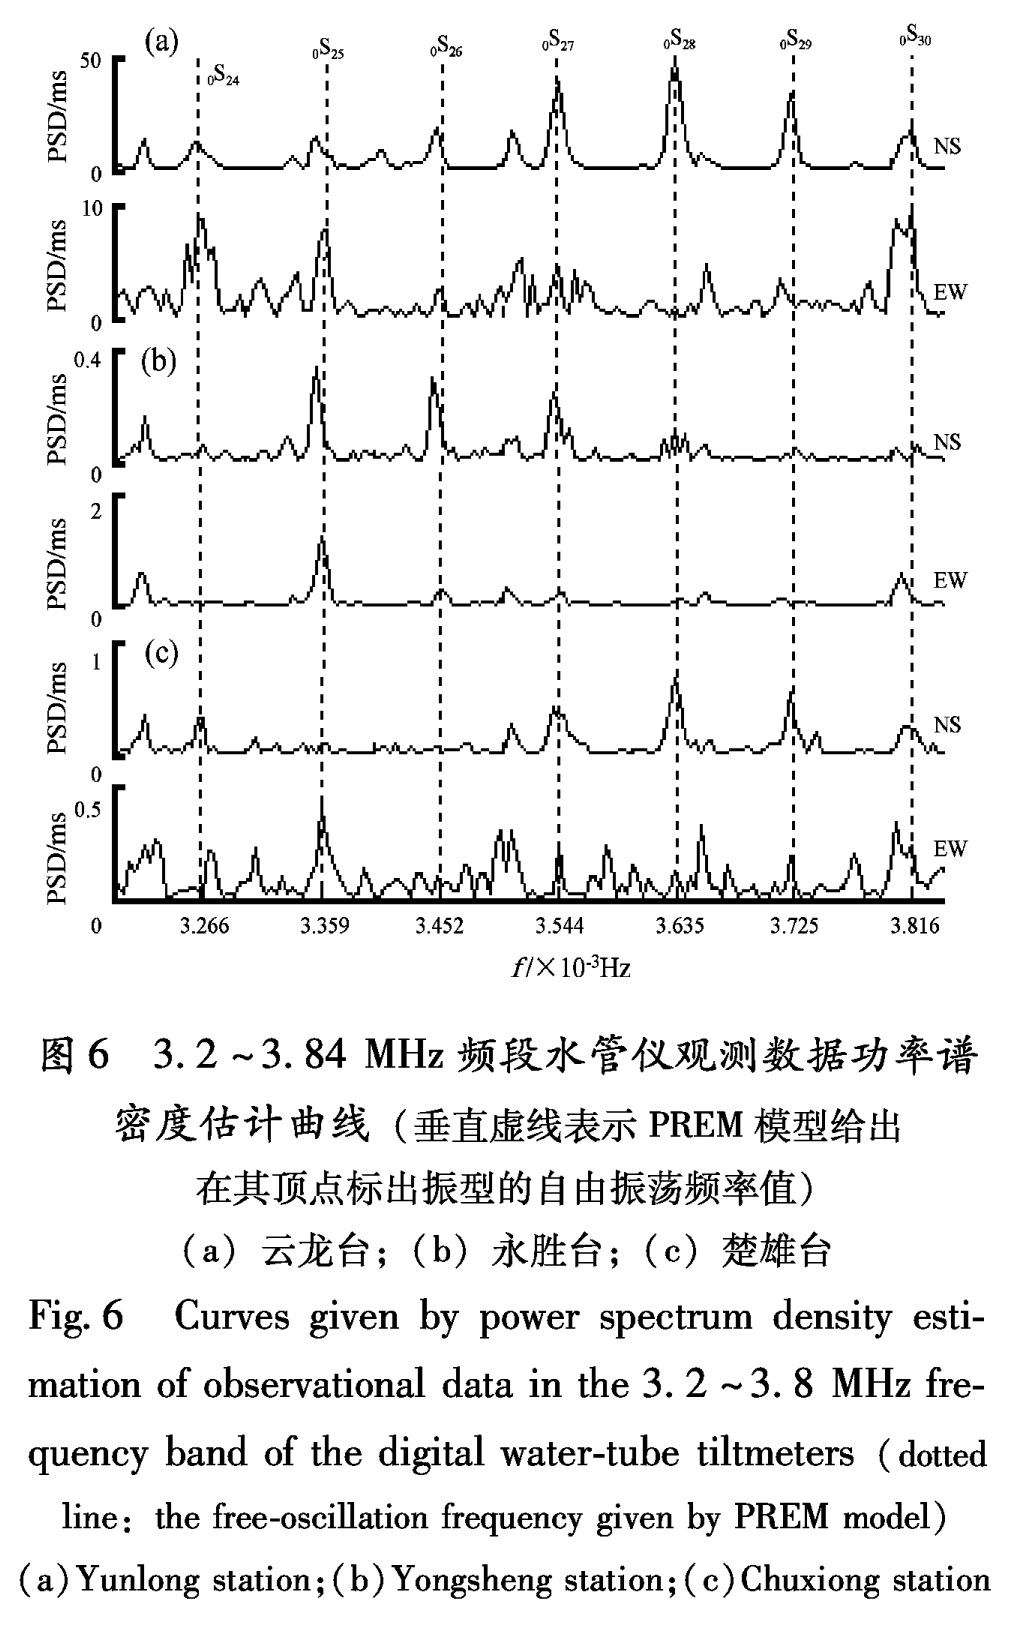
图6为3.2~3.84 MHz频段的功率谱密度(相对值)与PREM模型给出的球型振荡频率值的对应情况。可以看到,虽然在这个频段噪声比较大,但3三个台站的观测数据仍然可以较清楚地检测到球型基频振荡0S24~0S30。
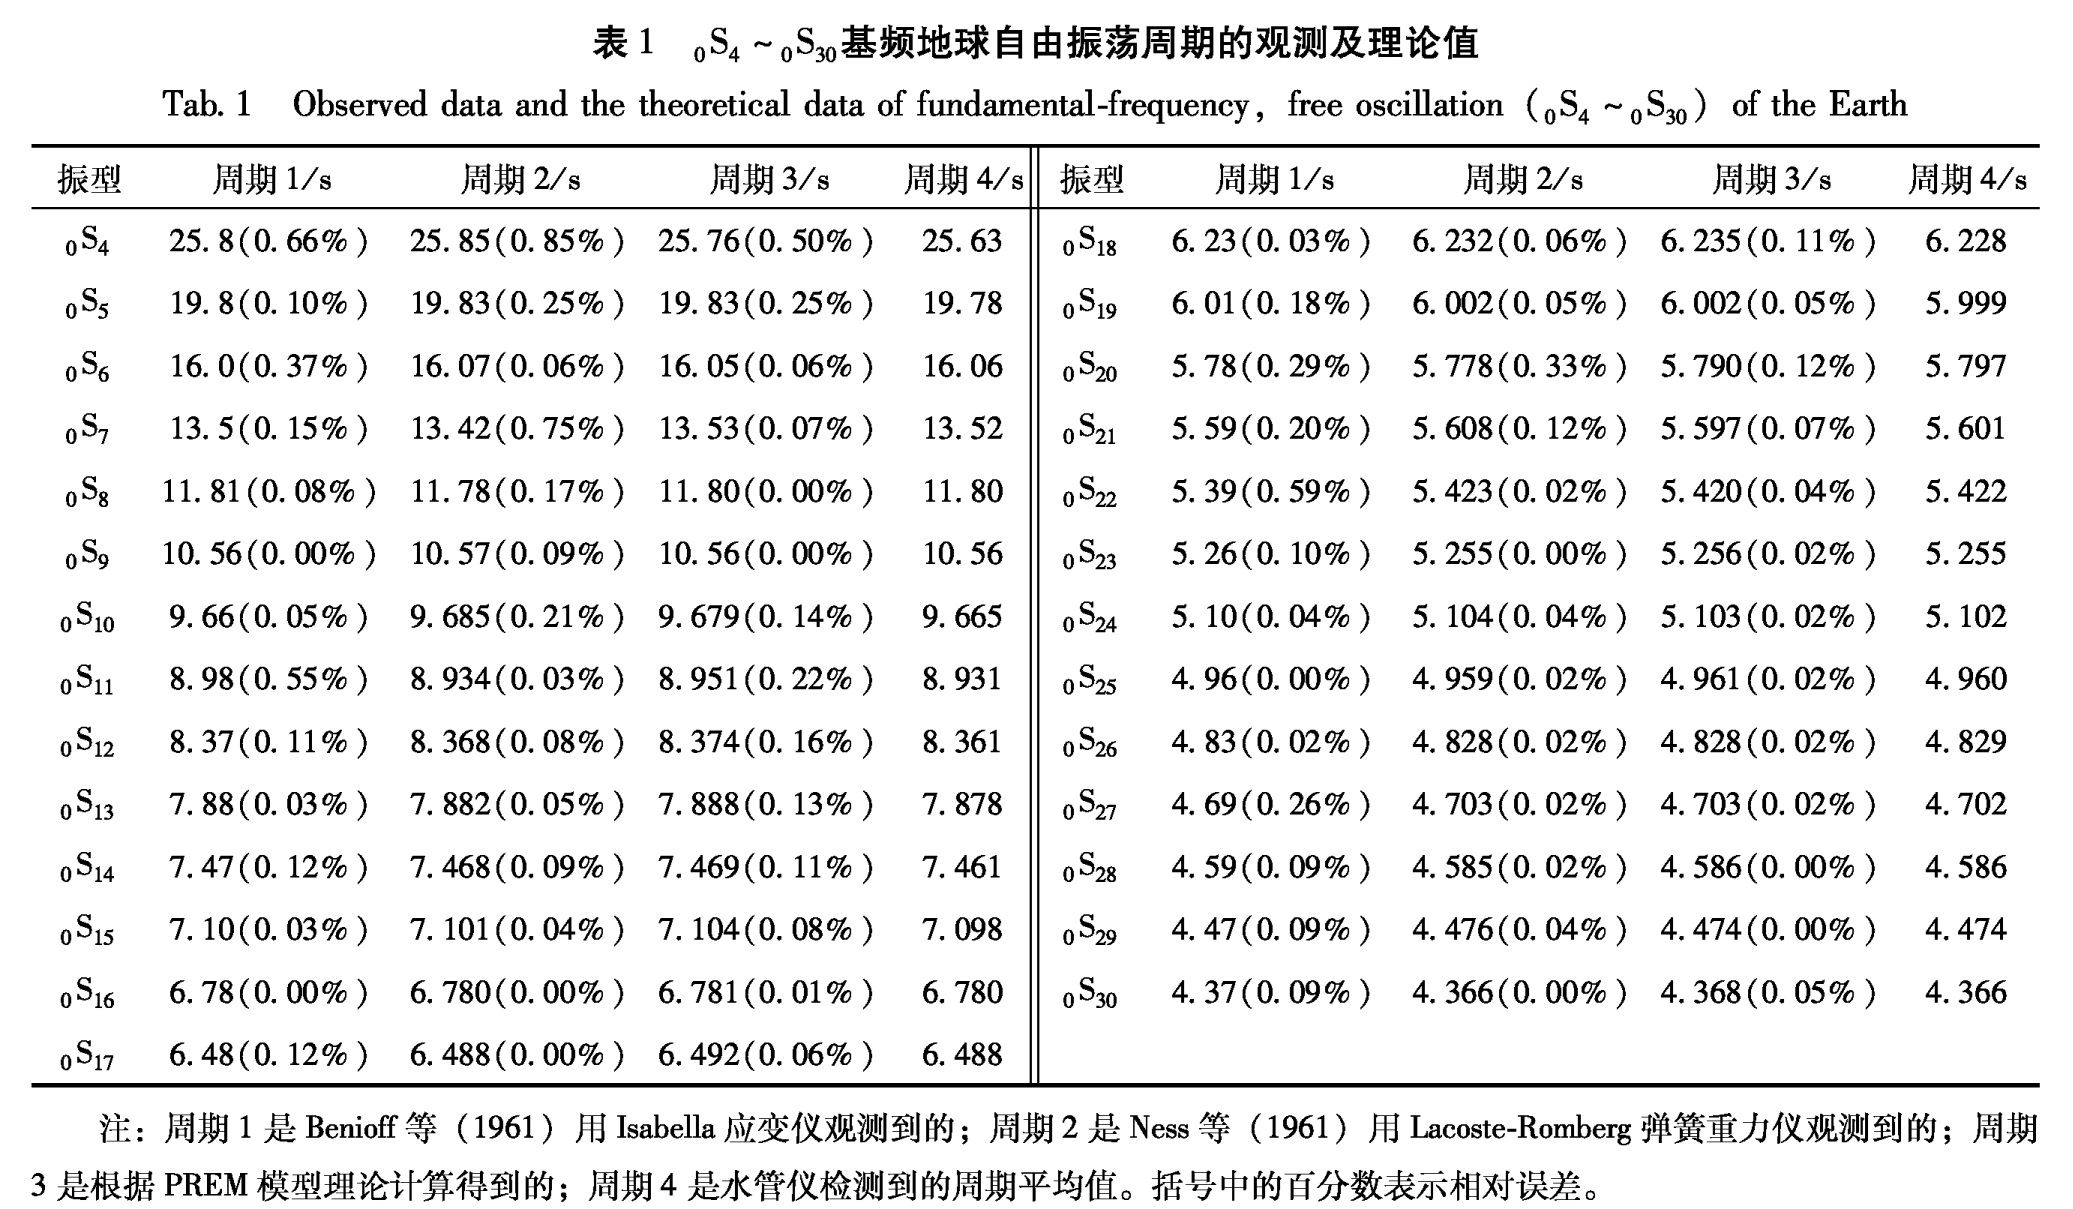
通过绘制印尼地震中3个台站的的功率谱,我们得到了球型振荡0S4~0S30等振型的周期平均值。将我们的观测结果与Benioff等(1961)用Isabella应变仪及Ness等(1961)用Lacoste-Romberg弹簧重力仪对自由振荡的观测进行了比较,同时对照了PREM模型的理论计算周期(表1)。 0S4~0S30的基频振型,水管仪观测所得数据与这三者符合得非常好,除0S4振型的观测周期和周期1、周期2、周期3的相对误差均大于0.3%外,其余的差别在3‰以下。在周期1、周期2中存在个别振型的相对误差大于0.3%的情形,通过对比发现,水管仪观测结果仅与其中一者的差别较大,而与另一观测结果却符合的很好,尤其与PREM模型符合的最好,我们认为,我们的观测结果可能在部分振型优于周期1和周期2的观测结果。
图5 2.4~3.2 MHz频段水管仪观测数据功率谱密度估计曲线(垂直虚线表示PREM模型给出在其顶点标出振型的自由振荡频率值)
(a)云龙台;(b)永胜台;(c)楚雄台
Fig.5 Curves given by power spectrum density estimation of observational data in the 2.4~3.2 MHz frequency band of the digital water-tube tiltmeters(dotted line:the free-oscillation frequency given by PREM model)(a)Yunlong station;(b)Yongsheng station;(c)Chuxiong station
图6 3.2~3.84 MHz频段水管仪观测数据功率谱密度估计曲线(垂直虚线表示PREM模型给出在其顶点标出振型的自由振荡频率值)
(a)云龙台;(b)永胜台;(c)楚雄台
Fig.6 Curves given by power spectrum density estimation of observational data in the 3.2~3.8 MHz frequency band of the digital water-tube tiltmeters(dotted line:the free-oscillation frequency given by PREM model)(a)Yunlong station;(b)Yongsheng station;(c)Chuxiong station
表1 0S4~0S30基频地球自由振荡周期的观测及理论值
Tab.1 Observed data and the theoretical data of fundamental-frequency,free oscillation(0S4~0S30)of the Earth
注:周期1是Benioff等(1961)用Isabella应变仪观测到的; 周期2是Ness等(1961)用Lacoste-Romberg弹簧重力仪观测到的; 周期3是根据PREM模型理论计算得到的; 周期4是水管仪检测到的周期平均值。括号中的百分数表示相对误差。