基金项目:地震行业科研专项重大项目(200908029)和地震行业科研专项(201008007)联合资助.
(First Crust Monitoring and Application Center,CEA,Tianjin 300180,China)
GNSS; non-deviation horizontal strain field; analytic formula,multi-kernel funtion; filtering; precision evaluation
备注
基金项目:地震行业科研专项重大项目(200908029)和地震行业科研专项(201008007)联合资助.
GNSS观测资料为研究地壳应变场提供了必要的依托,但如何较为完整或恰当地反映各种地壳应变信息仍存在缺陷。从连续变化的角度出发,在ITRF参考框架下水平运动场的基础上,借助于多核函数获得水平运动场的解析式,据此,利用球面上无偏差应变计算式给出应变场结果,再利用多核函数法进行空间滤波,最后给出了利用本方法进行应变计算的实际算例。该方法有如下特点:① 适用于各种空间尺度的地壳应变场描述,并且全面而又客观; ② 根据不同的需求和实际资料情况可提取不同频谱及其以内的应变信息; ③ 可对应变参量进行严密的精度评定;
GNSS observation data help us to reveal the crustal strain field,but the data have some shortcomings to reflect all kinds of strain information completely and appropriately.On the point of continuous variation,and on the foundation of the horizontal-motion field of ITRF reference frame,we obtain the analytic expression of horizontal-motion field by means of multi-kernel function.Further,the strain field result is given by using spherical non-deviation expression,and space filtering is carried on by means of multi-kernel function.Finally,we give a practical example of strain calculation using this method.Both theoretical and example analysis suggest that the method we proposed has characteristics as follows:① It is suitable for the strain field comprehensive and objective description of every space scale; ② Different frequency spectrum and its strain information can be extracted according to different requirements and data; ③ Precision of strain parameters can be evaluated rigorously; ④ Further analysis and calculation can be done on the foundation of analytic expression.
引言
目前,以全球导航卫星系统(Global Navigation Satellite System,简称GNSS)观测资料为依托的研究已是地震学科的一个重要分支。具体到地壳形变研究而言,人们有望利用GNSS资料从空间与时间的角度观察地壳的运动及形变的详细过程(王琪等,2000,杨国华等,2002,2006,2007,2008)。在早期的应变场研究中,有学者提出将形变场分块研究(王敏等,2003; 黄立人,王敏,2003),这使我们对块体的形变特征有一个总体的印象。然而,这毕竟不是空间上的细部描述,显得比较粗略。近年来,人们希望能够更加客观地得到形变场连续的细部变形特征,故而提出了一些新的方法:李延兴等(2004)给出了可描述地壳趋势性连续应变的模型; 杨国华等(2008,2009)在此基础上进一步提出了非线性应变连续模型,但从实质上讲都未离开低频应变的范畴; 江在森等(2003)提出的用最小二乘配置法解求应变的方法,使应变场的描述更加客观; Savage等(2001)给出了在球面上计算应变的方法。这些方法均存在偏差问题,从频谱的角度来看信息也不够完整。石耀霖和朱守彪(2006)、刘序俨等(2007)提出了在球面或椭球面上计算水平应变场的理论计算式,但由于需事先获取运动(位移)场的解析式及理论算式中涉及到基准的问题,这些算式没有被广泛认可与使用。杨国华等(2010)经过分析与论证后指出,石耀霖和朱守彪(2006)所给出的理论算式是无偏的,其他模型或算式在10-9/a量级上均存在偏差。利用石耀霖和朱守彪(2006)的算式的前提是获得运动(位移)场的解析式,除此之外,获得广谱应变信息后如何有效地进行信息分离也是一个亟待解决的问题。因此,本文试图对上述有关问题进行讨论,并结合实际算例给出结果。
1 水平应变场的解析描述
1.1 多核函数与水平运动场的解析表达多核函数法是Hardy在1971年提出的一种数值逼近方法。其基本思想是,任何数学表面和任何不规则的圆滑表面,总可以通过一系列有规则的数学表面的合成,以任意精度逼近。其数学表达式为
f(x,y)=∑mj=1cjsj(x,y,xj,yj).(1)
式中,sj(x,y,xj,yj)为核函数,(xj,yj)为核点的坐标,cj为待定系数。
核函数是一个非常简单的曲面形态,通常为“钵”形或“钟”形曲面函数。虽然哪一种形态的核函数更优尚无非常明确的定论,但在后来的应用研究中,该法已被广泛地用于地壳形变研究(黄立人,刘天奎,1989,杨国华,黄立人,1990)、DEM内插(周光文,黄莜容,1996)和地球重力场元内插(陶本藻,1992),并被证明是非常成功和有效的。然而,这种应用主要是侧重于数值逼近的应用。我们发现该方法若运用得当还具有滤波的功能。
事实上,多核函数在具体应用中的效果取决于如何选择,对于不同的描述对象可能会有不同的选择。所以,在实际应用中主要取决于使用者对多核函数及描述对象的理解。一般来说主要考虑以下三个方面:① 核函数的选择; ② 核函数中的参数选择; ③ 核函数的核点选择。由于我们所描述的对象是较大尺度的地壳应变场,而地壳介质由于其各向非同性、活动构造带的存在及应力大小与方向的空间变化等,使得应变场具有广谱性。兼顾数值逼近与滤波,本研究选用的核函数为“钵”形函数,具体为
sj(x,y,xj,yj)=daj+b.(2)
式中,dj=((x-xj)2+(y-yj)2)1/2。选用如此简单的核函数是因为使用该函数不存在量纲因子,使用者易于掌握,效果比较好。式中a的大小在核点确定之后影响波形,a越大波形的“峰”、“谷”性越突出。一般情况下,它的取值范围以1~2.5为宜,由于观测值带有误差,当测点不均匀时不宜取较大值。b以前被称为滤波因子,经验表明这种称呼不准确,因为它的大小对波形几乎无影响,但不可以为0。经过大量的试算发现,当测站分布不均匀或运动结果误差较大时,取值较大则影响数值逼近的正确性。为了稳妥起见,本文中取a=1.1、b=1。事实上,控制滤波效果或滤波成份,在宏观上由核点的空间分布所决定; 一般来说,核点间隔越大,得到的就是较低频段的结果,反之则为较高频段的结果。由于较大尺度应变场的描述是在球面上,故将(1)、(2)式合并为下式
〖JB<4{〗f(λ,φ)=∑cjsj(λ,φ,λj,φj)=STCT,
sj(λ,φ,λj,φj)=d1.1j+1.
(3)
式中,dj为球面上两点间的大地线长度,ST=(s1,s2,…,snx),CT=(c1,c2,…,cnx)。
在GNSS计算中通常以ITRF作为参考框架获取速度场。现假定(λj,φj)为测站j的位置坐标,ve(λj,φj)、vn(λj,φj)为其相应的东向和北向运动结果,在用多核函数进行数值逼近时应将所有测站位置作为核函数的核点位置,因此依据(3)式,对于任一方向均可列出n个方程(测站的个数),故可求解n个未知数(C)。这时可获得东、北向运动的解析式fe(λ,φ)、fn(λ,φ)。由此即可计算研究区任意位置的水平运动结果。即
f(λ,φ)=fe(λ,φ)i+fn(λ,φ)j.(4)
同理,利用测站东、北向运动的误差也可获得相应误差的解析式:
m(λ,φ)=me(λ,φ)i+mn(λ,φ)j.(5)
1.2 球面水平应变场的无偏差计算在球面坐标系非直角坐标系,若将平面应变计算式或由运动与应变关系式移植到球面上则必然存在偏差。根据石耀霖和朱守彪(2006)、刘序俨等(2007)所给出的球面应变计算式,只要基准恰当即可获取球面应变的无偏差结果。因此,若从参考基准的角度来看,球面上应变的正确计算似乎与运动场计算的参考基准有关。这一结论与经典应变分析所得到的与起算基准无关的结论相悖,故此该算式不被广泛地认同或使用者不知如何正确使用该模型。事实上,这是一种假象,球面应变计算式包含的非微分项应变计算恰恰是对偏差所进行的修正。对于如何正确使用该算式,杨国华等(2010)也给出了描述,只要利用ITRF参考框架所得到的水平运动(位移)场即可。现假定东西向应变为εe(λ,φ)、南北向应变为εn(λ,φ)、它们之间的剪应变为εen(λ,φ),在(4)式基础上和现行球面坐标系统下球面应变算式则为
{εe(λ,φ)=1/(Rcosφ)(fe(λ,φ))/(λ)-(fn(λ,φ))/Rtanφ,
εn(λ,φ)=1/R(fn(λ,φ))/(φ),
εen(λ,φ)=1/2[1/(Rcosφ)(fn(λ,φ))/(λ)+
1/R(fe(λ,φ))/(φ)+(fe(λ,φ))/Rtanφ].(6)
式中R为地球的平均半径。
在椭球面上的应变算式则为
{εe(λ,φ)=1/(Rncosφ)(fe(λ,φ))/(λ)-(fn(λ,φ))/(Rn)tanφ,
εn(λ,φ)=1/(Rm)(fn(λ,φ))/(φ),
εen(λ,φ)=1/2[1/(Rncosφ)(fn(λ,φ))/(λ)+
1/(Rm)(fe(λ,φ))/(φ)+(fe(λ,φ))/(Rn)tanφ].(7)
式中,Rn为卯酉圈曲率半径,Rm为子午圈曲率半径,λ为经度,φ为纬度。
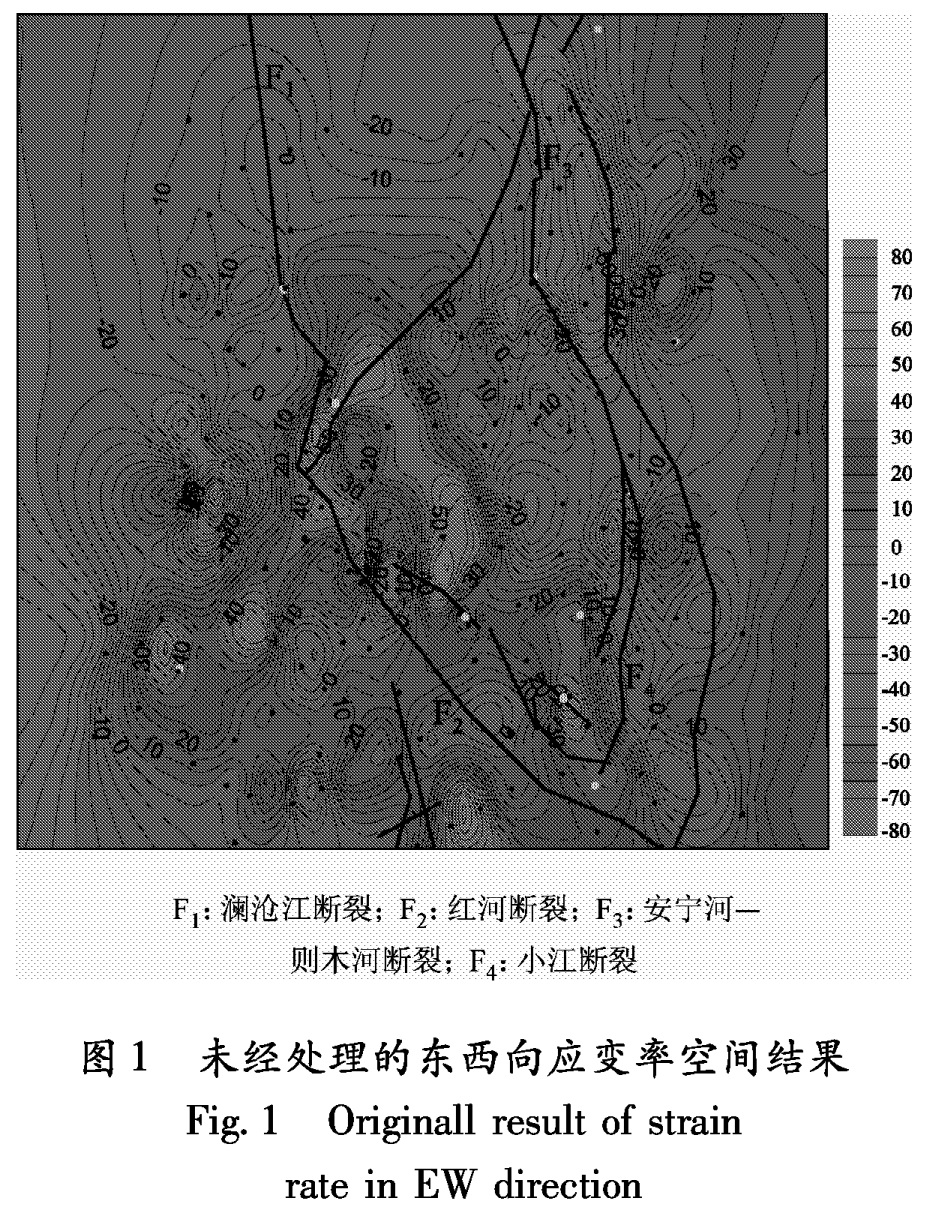
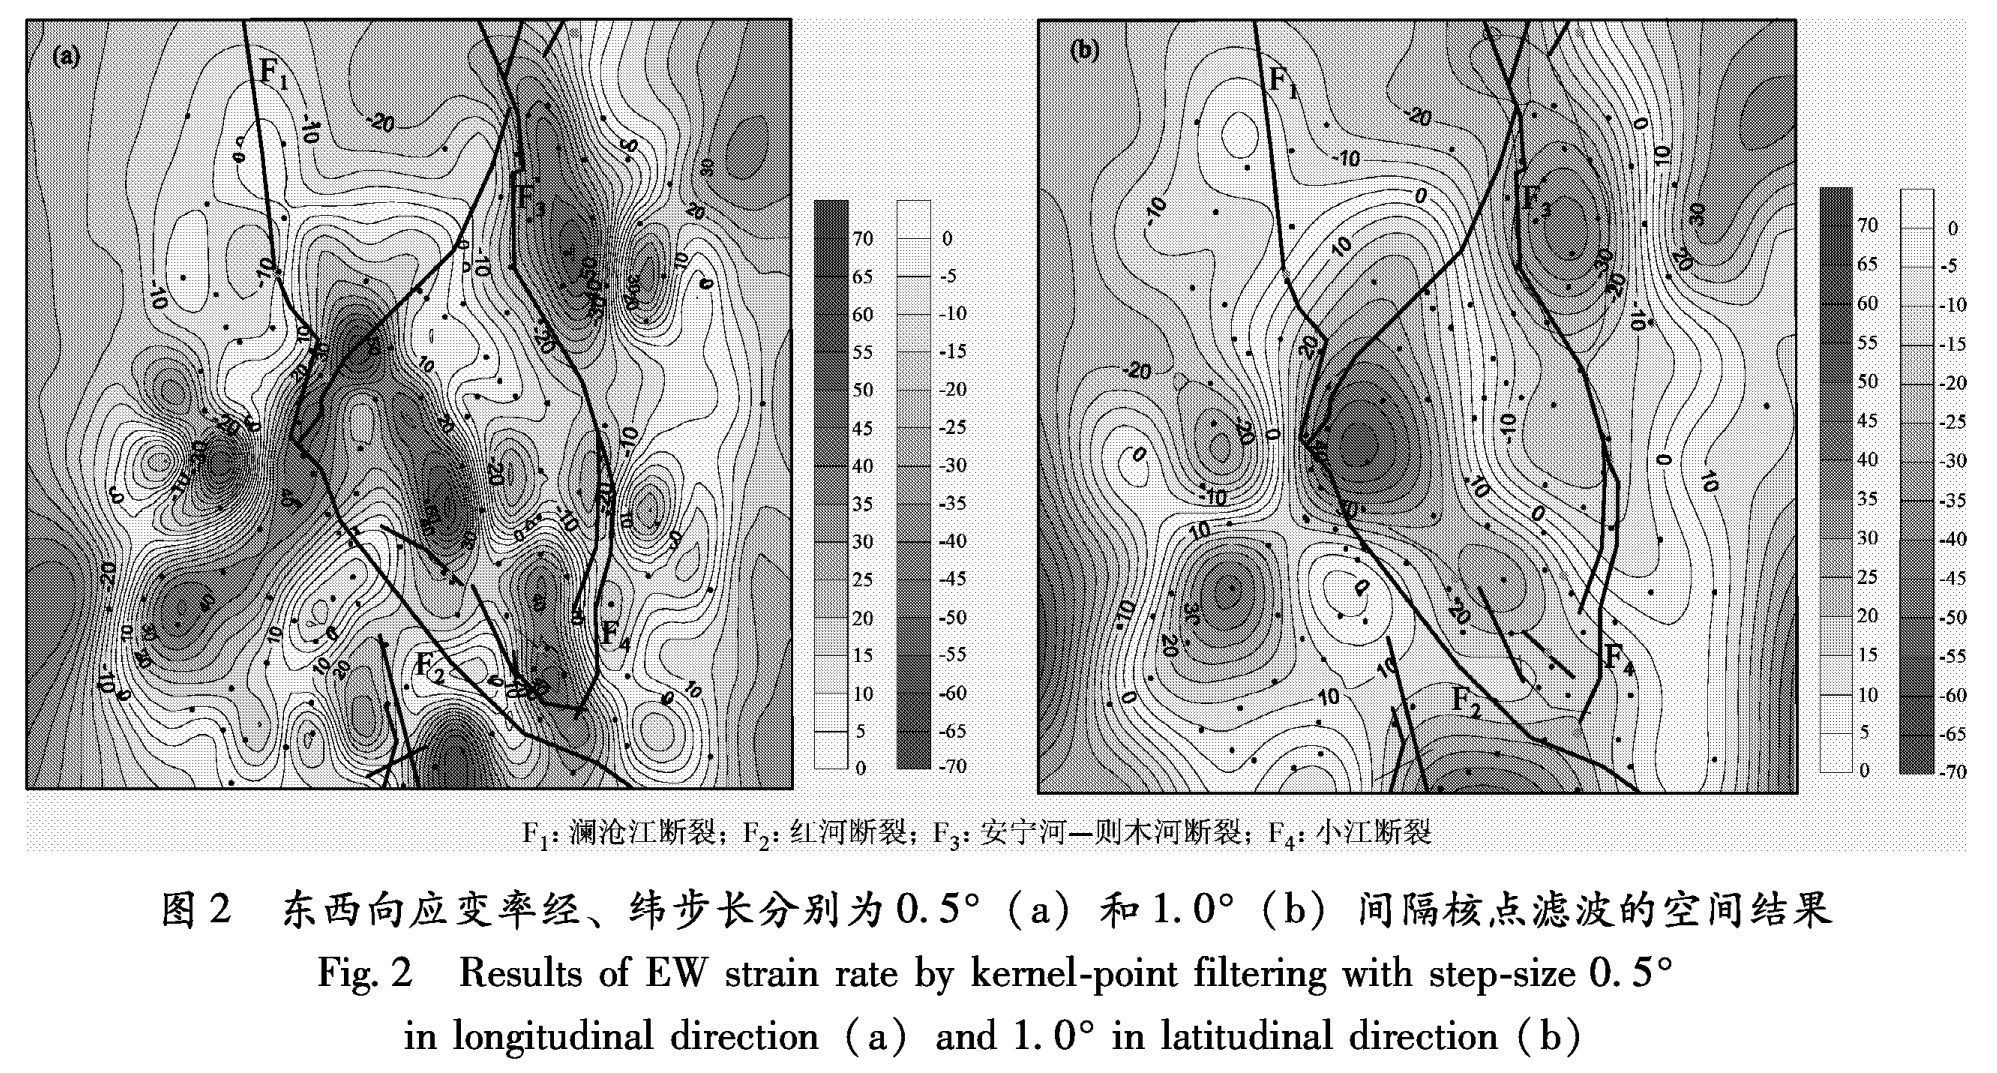
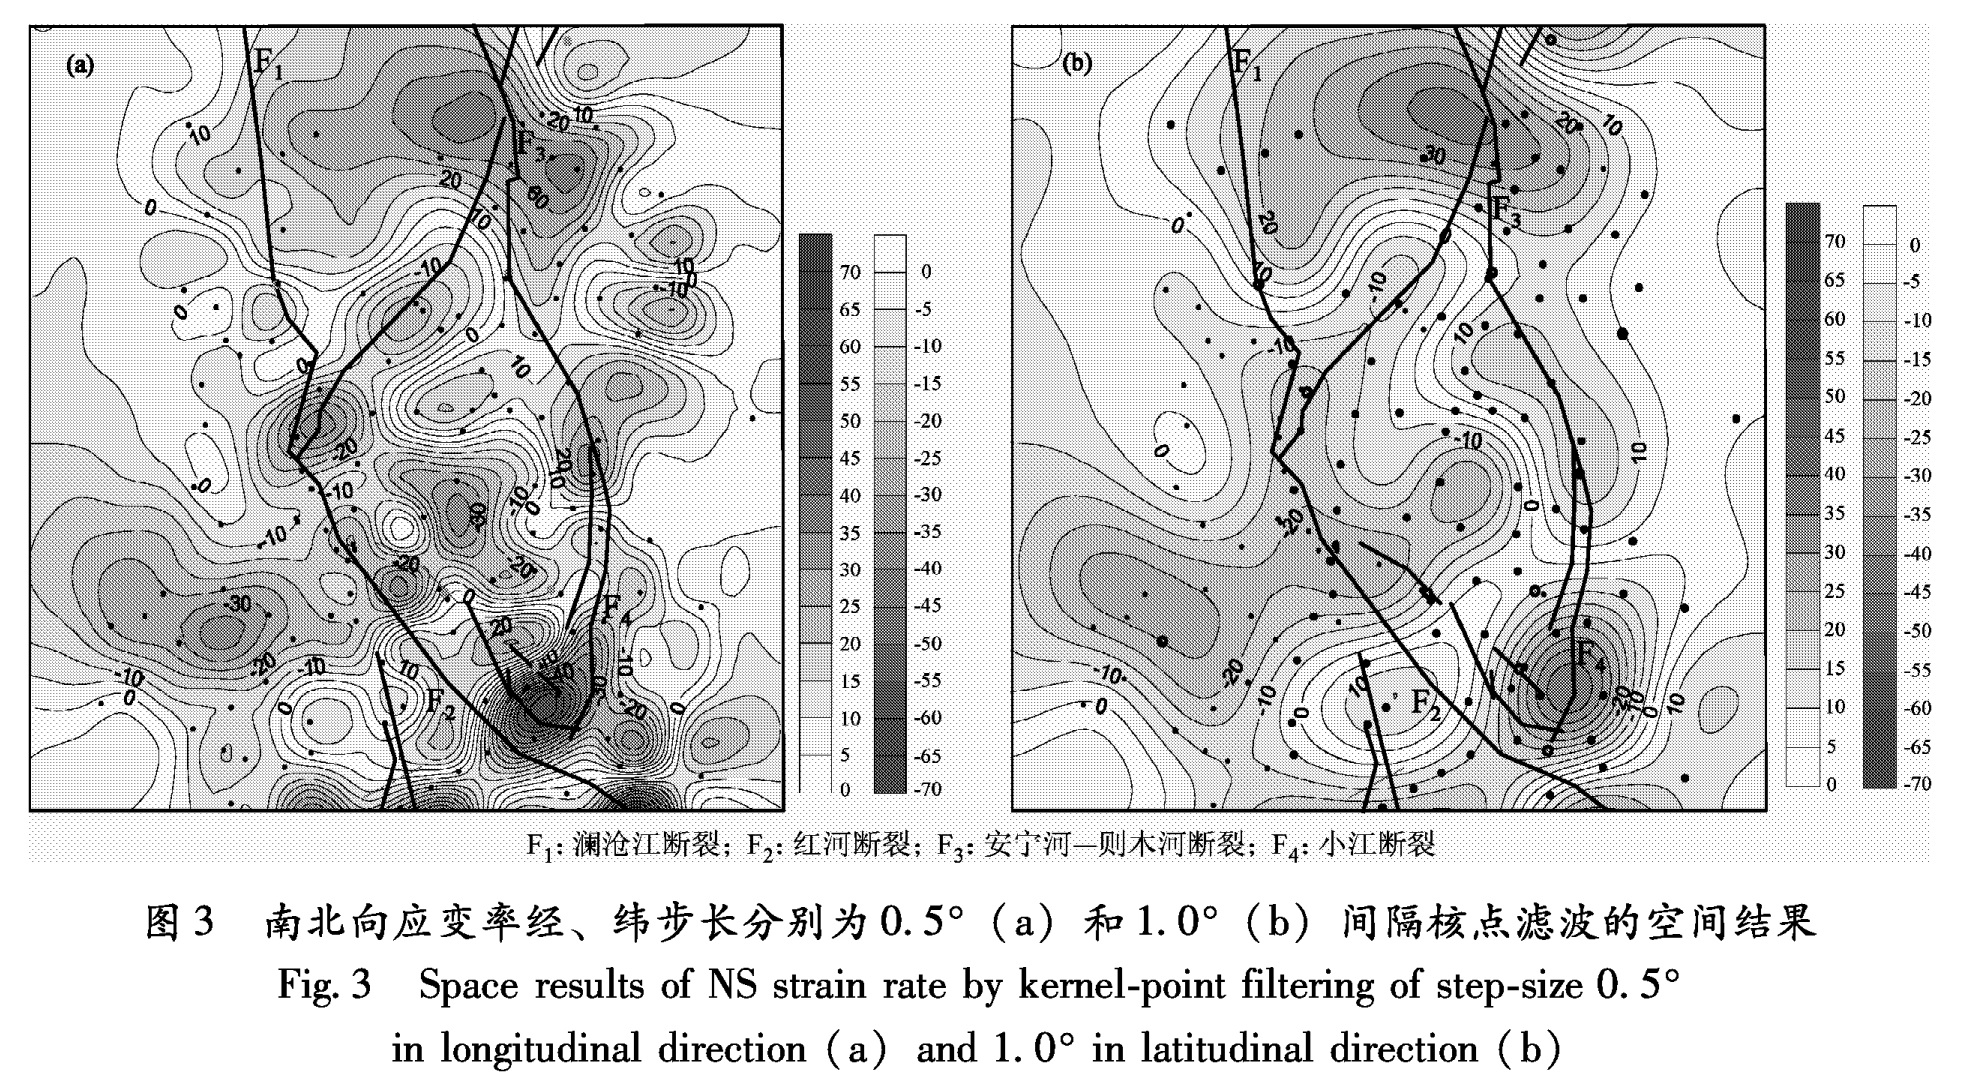
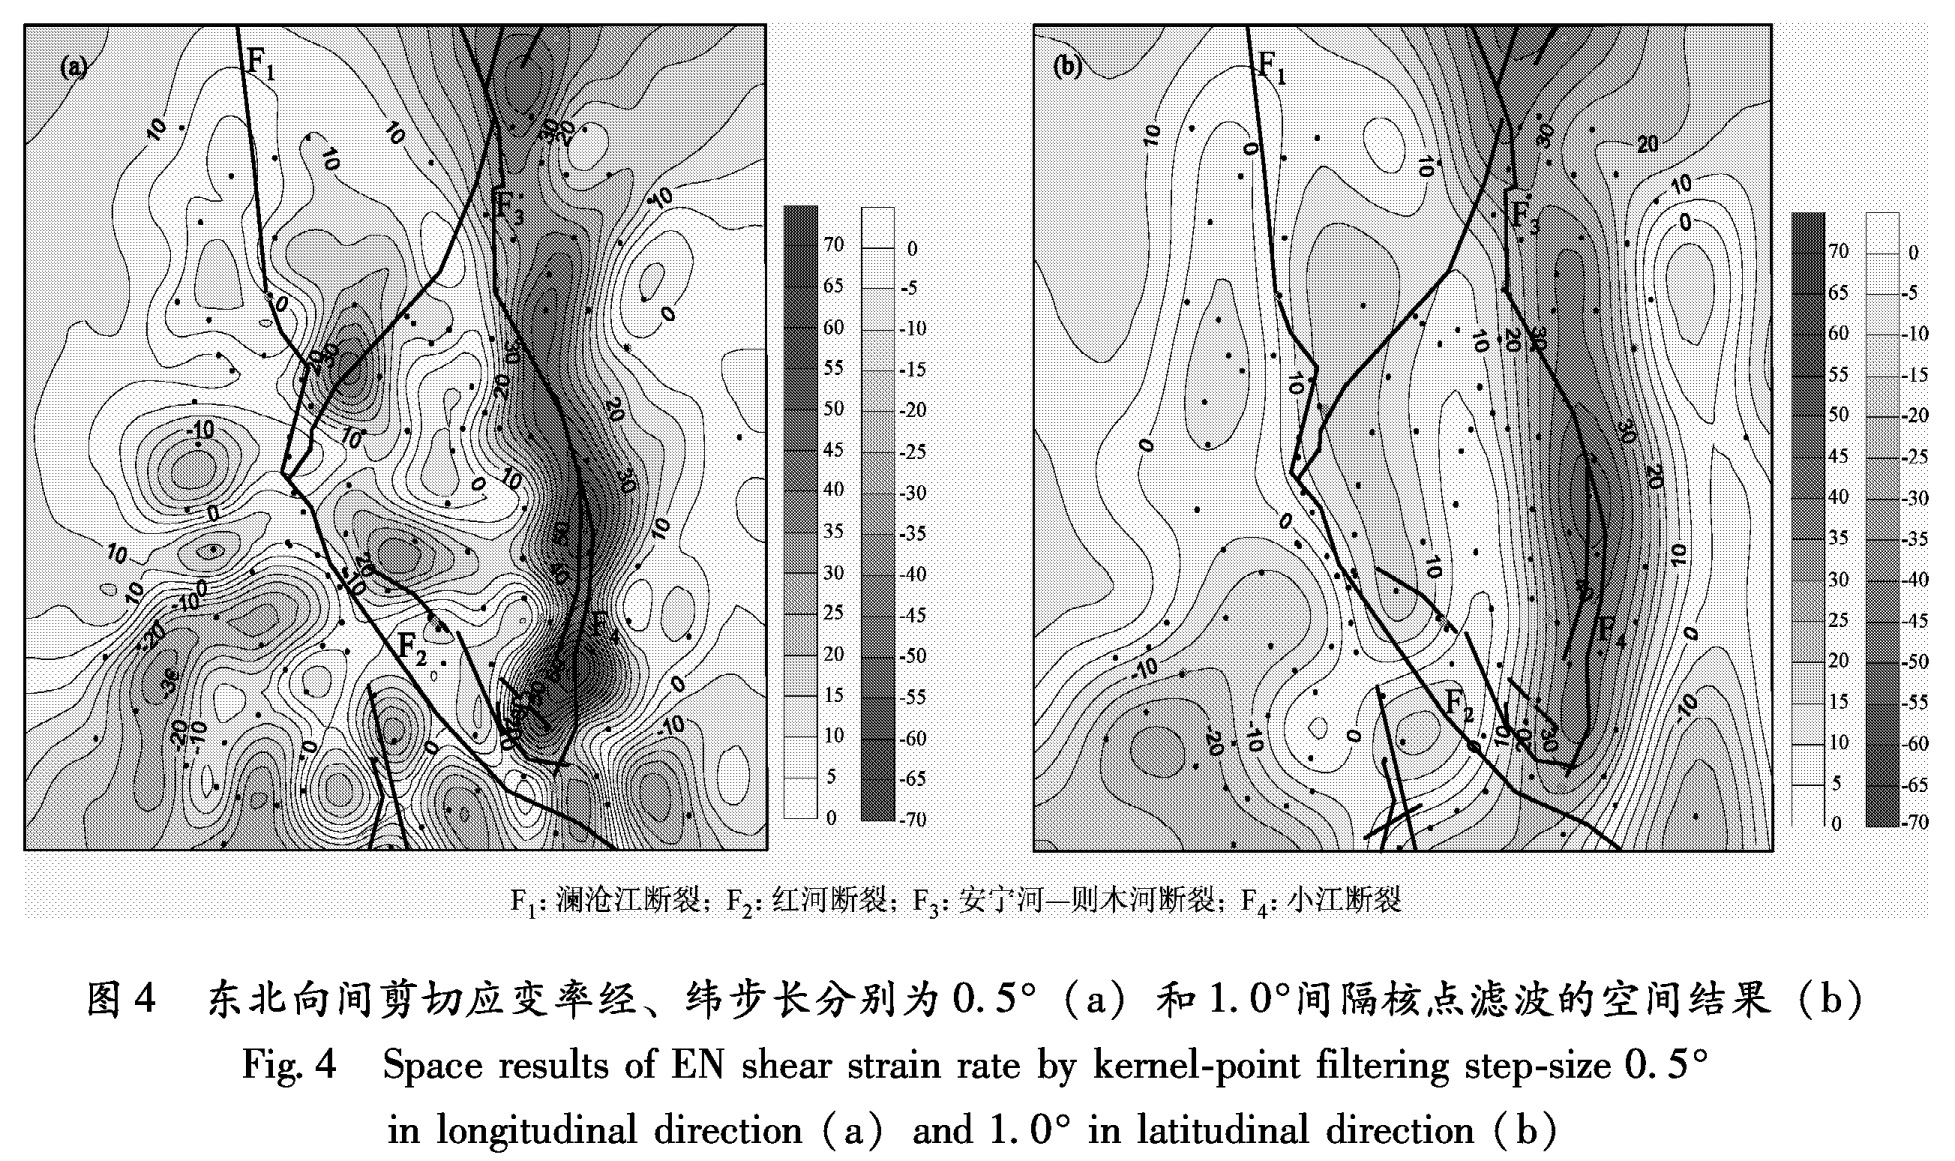
1.3 应变场的滤波计算上述数值逼近所得的水平运动场的解析结果,不仅包含运动信息,也包含误差干扰,所以由此得到的应变结果也必然不纯正。因此,进行滤波与信息分离是必要的。由于多核函数也具有滤波的功能,故本文利用多核函数法进行空间滤波。在进行滤波计算时,滤波效果或滤波层次的控制则取决于核点的选用与分布。从性质上看,核点的间隔越小,获得的应变信息所包含的频谱带宽越宽,可涵盖从低频至高频的范围,反之带宽越窄,也越趋于低频。在进行滤波计算时,由于应变场是由上述3个参数共同描述,而其他应变参数是通过这3个参数计算得到,所以为了保持应变场描述的协调性和彼此之间的相关性不被破坏,进行该3参数的滤波计算时应采用相同的滤波计算准则。因此,应变参数的滤波函数均表述为
{εe(λ,φ)=∑aisi(λ,φ,λi,φi)=STAT,
εen(λ,φ)=∑bisi(λ,φ,λi,φi)=STBT,
εn(λ,φ)=∑cisi(λ,φ,λi,φi)=STCT.
(8)
式中,AT=(a1,…,anx), BT=(b1,…,bnx), CT=(c1,…,cnx), 它们均为待定系数; ST=(s1,…,snx), si的具体形式如(3)所示,(λi,φi)为核点坐标。
在实际计算时,首先以相同的网格化形式获取各类应变数据,并以此作为应变观测值。然后,根据最小二乘法求解上述待定系数,即对每一类应变通过误差方程
V=DX+L,(9)
建立相应的法方程
NX+W=0,(10)
并由此求解(待定系数)为
X=-N-1W.(11)
其中,N=DTPL,W=DTPD,L为应变观测值的矩阵,P为应变观测值的权矩阵(pi=1/m2i,mi在下一节给出具体算式)。
求得X后,(8)式则变为经滤波后应变计算的函数解析式,据此可获得其他应变的函数解析式,即最大主应变为
εmax(λ,φ)=(εe(λ,φ)+εn(λ,φ))/2+
((4ε2en(λ,φ)+[εe(λ,φ)-εn(λ,φ)]2)1/2)/2,(12)
最小主应变为
εmin(λ,φ)=(εe(λ,φ)+εn(λ,φ))/2-
((4ε2en(λ,φ)+[εe(λ,φ)-εn(λ,φ)]2)1/2)/2,(13)
最大剪应变为
γmax(λ,φ)=(εmax(λ,φ)-εmin(λ,φ))/2
=((4ε2en(λ,φ)+[εe(λ,φ)-εn(λ,φ)]2)1/2)/2,(14)
面应变为
Δ(λ,φ)=εmax(λ,φ)+εmin(λ,φ)
=εe(λ,φ)+εn(λ,φ),(15)
最大主应变方向为
θ(λ,φ)=arctan((εmax(λ,φ)-εe(λ,φ))/(εen(λ,φ))).(16)
1.4 应变参数的精度评定
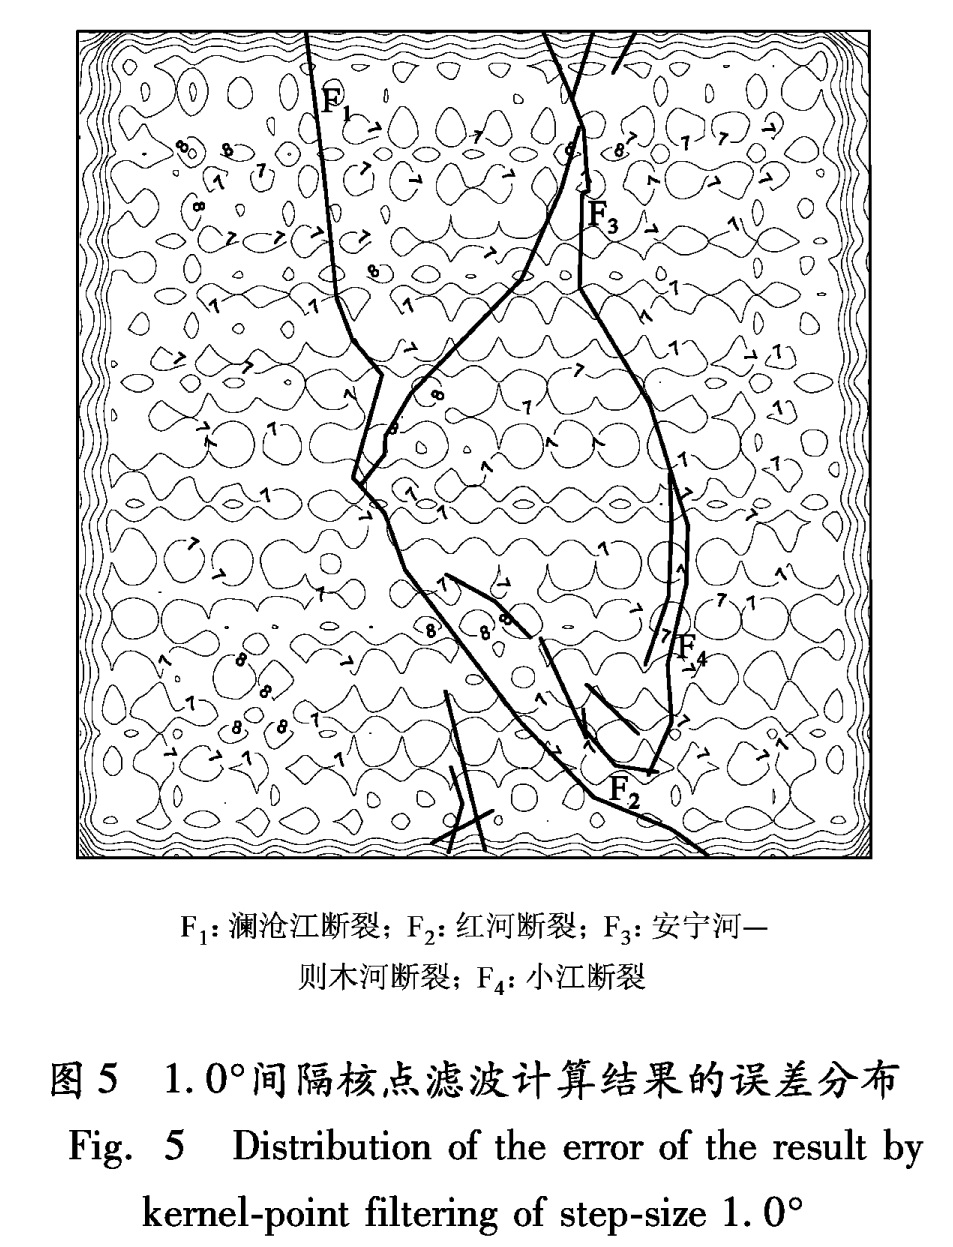
上述有关章节只给出了无偏应变的算式((6)~(8)式),但没有给出相应的误差估计。该误差估计不仅可使我们了解无偏应变的误差,更重要的是该误差是此后滤波计算的定权依据,以及有关应变误差传递计算所需要的相关系数。故此我们给出具体算式,为了简单起见做了适当简化,即误差传播时只考虑微分项,因为修正项的误差较微分项的误差小数十倍; 此外,由于协方差矩阵太大,通常给研究者所提供的GNSS计算结果中不包含不同测站速度间的协误差,所以以下计算式不再考虑它们之间的相关性问题。因此,依(6)式并兼顾(5)式及实际计算时的网格化特点,各个应变的误差为
{mεe(λ,φ)=1/(Δsλ)(m2e(λ,φ)+m2e(λ+Δλ,φ))1/2,
mεn(λ,φ)=1/(Δsφ)(m2n(λ,φ)+m2n(λ,φ+Δφ))1/2,
mεen(λ,φ)=1/2(1/(Δsλ)(m2n(λ,φ)+m2n(λ+Δλ,φ))1/2+
1/(Δsφ)(m2e(λ,φ)+m2e(λ,φ+Δφ))1/2).(17)
其中Δsλ、Δsφ、Δλ、Δφ分别为应变网格化计算时经、纬方向上的距离步长和经纬步长。各应变之间的协方差为
{mεe,n(λ,φ)=0,
mεe,en(λ,φ)=1/(2ΔsφΔsλ)m2e(λ,φ),
mεn,en(λ,φ)=1/(2ΔsφΔsλ)m2n(λ,φ).(18)
其相应的相关系数为
{Re,n(λ,φ)=0,
Re,en(λ,φ)=(mεe,en(λ,φ))/(mεn(λ,φ)mεen(λ,φ)),
Rn,en(λ,φ)=(mεn,en(λ,φ))/(mεn(λ,φ)mεen(λ,φ)).(19)
进行滤波计算后,由(10)式利用测站位置的残差可计算相应的应变单位权方差估值,东向、剪切和北向分别为
m20e=(VTePeVe)/(n-nx),(20)
m20en=(VTenPenVen)/(n-nx),(21)
m20n=(VTnPnVn)/(n-nx).(22)
式中,nx为核点的个数,n为测站个数,且大于nx,否则无法给出精度评定,也达不到滤波的目的。(20)~(22)式中的残差均是测站点位置的相应残差。根据误差传播定律,可求各应变参量的误差。令
Qj=N-1j.(23)
式中,j=ee,enen,nn,因此东西向、剪切和南北向应变方差分别为
m2ee(λ,φ)=m20eSTQeeS,(24)
m2enen(λ,φ)=m20enSTQenenS,(25)
m2nn(λ,φ)=m20nSTQnnS,(26)
东西向应变与剪应变协方差为
me,en(λ,φ)=mee(λ,φ)·menen(λ,φ)·Re,en(λ,φ),(27)
南北向应变与剪应变协方差为
mn,en(λ,φ)=mnn(λ,φ)·menen(λ,φ)·Rn,en(λ,φ),(28)
最大主应变方差为
m2εmax(λ,φ)=f 21(λ,φ)m2ee(λ,φ)+f 22(λ,φ)m2enen(λ,φ)+f 23(λ,φ)m2nn(λ,φ)+2f1(λ,φ)f2(λ,φ)me,en(λ,φ)+2f2(λ,φ)f3(λ,φ)men,n(λ,φ),(29)
最小主应变方差为
m2rmin(λ,φ)=f 23(λ,φ)m2ee(λ,φ)+f 22(λ,φ)m2enen(λ,φ)+f 21(λ,φ)m2nn(λ,φ)-2f3(λ,φ)f2(λ,φ)me,en(λ,φ)-2f2(λ,φ)f1(λ,φ)men,n(λ,φ),(30)
最大剪切应变方差为
m2rmax(λ,φ)=[h21(λ,φ)m2ee(λ,φ)+h22(λ,φ)m2enen(λ,φ)+h23(λ,φ)m2nn(λ,φ)+2h1(λ,φ)h2(λ,φ)me,en(λ,φ)+2h2(λ,φ)h3(λ,φ)men,n(λ,φ)]/2,(31)
面应变方差为
m2Δ(λ,φ)=m2ee(λ,φ)+m2nn(λ,φ).(32)
式中,
f1(λ,φ)=(2γmax(λ,φ)+εe(λ,φ)-εn(λ,φ))/(4γmax(λ,φ)),(33)
f2(λ,φ)=(εen(λ,φ))/(γmax(λ,φ)),(34)
f3(λ,φ)=(2γmax(λ,φ)+εn(λ,φ)-εe(λ,φ))/(4γmax(λ,φ)),(35)
h1(λ,φ)=(εe(λ,φ)-εn(λ,φ))/(4γmax(λ,φ)),(36)
h2(λ,φ)=(εen(λ,φ))/(γmax(λ,φ)),(37)
h3(λ,φ)=(εn(λ,φ)-εe(λ,φ))/(4γmax(λ,φ)).(38)
2 算例简析
川滇地区是我国地震活动最为频繁和强烈的地区之一,故在此布设了较密集的中国地壳运动网络GPS流动测站,用于监测该地区地壳形变及其动态变化。现以1999~2007年ITRF参考框架的平均水平运动速度结果为例进行简要分析。图1是未经处理的东西向应变率结果。首先依据(3)~(5)式对研究区ITRF参考框架的速度及误差结果进行数据逼近,以获得解析式,然后结合(7)式,对按经、纬步长分别为0.2°计算3个基本应变参量εe(λ,φ)、εn(λ,φ)和εen(λ,φ)和εub>(λ,φ)在网格点上的结果,并在此基础上再进行空间滤波计算。作为算例,这里选用的核点经、纬步长分别
图2是未经处理的东西向应变率在两种核点情况下的滤波结果。相比之下,图1所包含的频谱范围最宽,因此,应变曲面的起伏程度也最强; 图2a包含的频谱较宽,曲面较前光滑; 图2b的趋势性变化特征则显现得更加清晰。从理论上讲,采用核函数法进行滤波,核点间的间隔越小,包含的不同频谱形变信息就越全面,这既是其优点也是其缺点,因为各种信息都融在一起,人们不太容易抓住所关心的信息。反之,核点间的间隔越大,由其所得到的滤波结果就越趋向于较低频谱的形变信息,也就说较高频信息被滤掉(高频信息中往往以误差干扰为主)。一般地说,进行滤波通常主要考虑两个方面的问题,即噪声削弱与不同层次的信息分离。从这层意义讲,图2a主要是对噪声削弱的处理结果,从结果看削弱的程度似乎还不太理想,因此不同频谱形变的成份也得以较全面地保留,所以张压变化比较剧烈,梯度值比较高,但这样的结果不利于对趋势性的把握; 而图2b则主要显示中—低频的形变信息,趋势性变化较为清晰。这一变化为我们把握全局趋势而又尽量不失较局部的细化特征提供了可能。事实上,对于不同的研究对象,其核点间的步长不会完全相同,故难以确定谁优谁劣。若以研究趋势性变化为目标,则图2b的结果最佳。下面主要对图2b的结果给出简要的分析,同时也展示图2a的结果。
由图2b可知,地壳的压性应变主要分布在川滇菱形块体的东边界带和川滇地区的西北地域,压性应变的高值区集中在西昌地区,约为-35×10-9/a。地壳的张性应变主要分布在丽江、龙陵、楚雄、建水等所围限的区域,最大值集中在丽江地区,约为55×10-9/a。但在丽江、楚雄、龙陵等地区张压应变形成了象限的图像特征。从空间的角度讲,场的张压变化过程比较有序,符合理论上的认知。应该说,通过滤波处理能使我们观察得如此清晰,而不被其他信息所干扰。从孕震角度来看,具有较大空间尺度的象限图像常与强震孕育过程的地壳形变图像相对应。此外,西昌地区压应变较大有助于构造区段的应变能高量积累,所以均应值得关注。
图2 东西向应变率经、纬步长分别为0.5°(a)和1.0°(b)间隔核点滤波的空间结果
Fig.2 Results of EW strain rate by kernel-point filtering with step-size 0.5°in longitudinal direction(a)and 1.0° in latitudinal direction(b)图3是南北向应变率在两种核点情况下的滤波结果。图3a保持着较丰富频谱的各种信息,图3b则主要显现趋势性应变信息。由该图可知,南北向的张性应变率主要分布于研究区的东部和昆明以北的地域。西昌以北—雅安的区域应变最大,约为35×10-9/a; 东川—昭通地区次之,量值为15×10-9/a; 这两个区域之间的西昌地区相对较小,约为10×10-9/a; 楚雄以南的地区也表现为张性地区,量值较小,约为10×10-9/a,但较为局部。压性地区主要集中在丽江、楚雄、龙陵所围限的地区,量值最大达25×10-9/a,但最大值并不在此区域,而在玉溪与建水之间,为40×10-9/a,但比较局部。这是该区张、压应变分布的基本特征。近几十年来该区强震活动也主要集中在压性应变地区,由此可看出强震活动有着深刻的形变背景。
图3 南北向应变率经、纬步长分别为0.5°(a)和1.0°(b)间隔核点滤波的空间结果
Fig.3 Space results of NS strain rate by kernel-point filtering of step-size 0.5°in longitudinal direction(a)and 1.0° in latitudinal direction(b)图4是东、北向间剪切应变率在两种核点情况下的滤波结果。图4b清楚地显示,研究区东边界带左旋剪切形变非常突出; 图4a和图4b都显示该边界并不是纯粹的走滑活动带,因此必然存在剪切应变能的积累。从该带应变的大小分布来看,构造活动并非处处均匀,西昌以北近百千米的区段应变最小,由此提示我们该区段可能是应变亏损区段,值得关注。研究区西边界带当前形变相对较弱,甚至难以分辨是右旋还是左旋性质的活动,这表明该带的差异活动不明显。穿过龙陵的
南北条带表现为右旋形变,最大应变率位于龙陵地区,达25×10-9/a; 楚雄—丽江地区则为左旋形变,最大应变率为25×10-9/a。从等值线的走向来看,以南北向为优势,左旋与右旋形变由西向东呈交替有序性分布。这些是该区东、北向间剪切应变分布的基本特征。由于篇幅所限,本
图4 东北向间剪切应变率经、纬步长分别为0.5°(a)和1.0°间隔核点滤波的空间结果(b)
Fig.4 Space results of EN shear strain rate by kernel-point filtering step-size 0.5°in longitudinal direction(a)and 1.0° in latitudinal direction(b)图5 1.0°间隔核点滤波计算结果的误差分布
Fig.5 Distribution of the error of the result by kernel-point filtering of step-size 1.0°3 结语
本文所给的方法较好地实现了运动场、无偏应变场的解析表达,同时也给出了应变场空间滤波的算法及相应的严密精度评定算式,较好地弥补了当前应变场计算中的诸多不足。由于所计算的应变结果是客观的、信息是全面的,故可根据研究的目标与需求,通过不同层次的滤波从中获取值得关注的应变信息,为水平应变信息的正确与有效提取提供了保证。
本研究得到了中国地震局第一监测中心杨国华研究员的指导,中国地震局地质研究所王敏研究员为本研究提供了运动场结果,审稿专家提出了宝贵建议,在此深表感谢。
- 黄立人,刘天奎.1989.用速度面拟合法研究华北部分地区的先进地壳垂直运动[J].地壳形变与地震,9(3):6-12.
- 黄立人,王敏.2003.中国大陆构造块体的现今活动和变形[J].地震地质,25(1):23-32.
- 江在森,马宗晋,张希.2003.GPS初步结果揭示的中国大陆水平应变场与构造变形[J].地球物理学报,46(3):352-358.
- 李延兴,李智,张静华,等.2004.中国大陆及周边地区的水平应变场[J].地球物理学报,47(2):222-231.
- 刘序俨,黄声明,梁全强.2007.旋转托球面上的应变与转动张量表达[J].地震学报,29(3):240-249.
- 石耀霖,朱守彪.2006.用GPS位移资料计算应变方法的讨论[J].大地测量与地球动力学,26(1):1-8.
- 陶本藻.1992.GPS水准似大地水准面拟合和正常高计算[J].测绘通报,(4):14-18.
- 王敏,沈正康,牛之俊,等.2003.现今中国大陆地壳运动与活动块体模型[J].中国科学(D辑),33(增刊):21-32.
- 王琪,丁国瑜,乔学军,等.2000.天山现今地壳块缩短与南北地块的相对运动[J].科学通报,45(14):1543-1547.
- 杨国华,韩月萍,杨博.2009.川滇地区地壳水平运动与变形场的演化特征及其机制讨论[J].地震研究.32(3):275-283.
- 杨国华,黄立人.1990.速度面拟合法中多面函数几个特性的初步数值研究[J].地壳形变与地震,10(4):70-82.
- 杨国华,李延兴,韩月萍,等.2002.由GPS观测结果推导中国大陆现今水平应变场[J].地震学报,24(4):337-347.
- 杨国华,江在森,刘广余,等.2007.华北地区的水平运动场与昆仑山8.1级地震的可能关系[J].大地测量与地球动力学,27(2):10-15.
- 杨国华,江在森,王敏.2006.印尼地震对我国川滇地区地壳水平活动的影响[J].大地测量与地球动力学,26(1):9-14.
- 杨国华,杨博,武艳强,等.2010.应变计算与分析的若干问题及有关偏差的修正[J].大地测量与地壳动力学,30(4):59-63.
- 杨国华,杨博,张风霜,等.2009.汶川地震对华北地区水平形变场影响及有关含义的讨论[J].地震,29(1):77-83.
- 杨国华,张风霜,武艳强,等.2008.利用GPS连续观测资料进行强震危险性预测的探讨[J].地震,28(1):33-39.
- 杨国华,张晓东,张风霜,等.2008.昆仑山口西8.1级地震震后中国西部地壳水平位移场的变化特征[J].地震研究.31(1):77-82.
- 周光文,黄莜容.1996.一种改进的多面多面函数法[J].测绘通报,(6):6-8.
- Savage J C,Gan W,Svare J L.2001.Strain accumulation and rotation in the Eastern California Shear Zone[J].JGR,106(B10):21995-22007.