时间序列噪声分析可以选用频谱分析、极大似然估计(MLE)等方法完成。频谱分析相对MLE方法计算运行速度要快,但要求数据均匀采样,依赖于频谱平均,可选择的噪声模型种类较少,且频谱分析方法无法得到测站的函数模型,而MLE方法可以同时估计噪声类型、周期性振幅、测站速度及不确定度,不需要数据均匀采样,被认为是目前最准确的噪声分析方法(Zhang et al,1997),其主要原理是对GPS日解坐标分量时间序列建立如式(1)所示的参数模型:
y(ti)=a+bti+csin(2πti)+dcos(2πti)+
esin(4πti)+fcos(4πti)+
Σnjj=1gjH(ti-Tgj)+vti.(1)
式中,ti为坐标序列日解历元,以年为单位; a为对应于时间序列起始年份第一天的测站位置(即横轴截距); b为线性速度; c、d和e、f分别为年周期项和半年周期项系数,可根据设计方案需要判断是否求解; gj为由于各种原因引起的阶跃式坐标突变,Tgj为发生突变的历元; H为海维西特阶梯函数,发生突变前H值为0,发生突变后H值为1; vti为观测噪声,可表示成不同噪声模型的组合,假设由振幅分别为aw和bk的白噪声及幂律谱噪声组成,则有
vti=awα(ti)+bk β(ti).(2)
观测值协方差阵可表示为
C=a2wI+b2kJk.(3)
式中,I为单位阵,Jk对应谱指数为k的幂律谱噪声协方差阵,其计算公式为
Jk=TTT.(4)
转换矩阵T的表达式为
T=T-k/4[φ0 0 … 0
φ1 φ0 … 0
… … … …
φN φN-1 … φ0].(5)
式中,N>0,φ0=1,T为采样间隔,当数据采样不等间隔时,对矩阵各列分别乘上相应系数 。Tj=|tj-tj-1|。k=-1时,表示闪烁噪声,k=-2时,表示随机漫步噪声。
按照极大似然估计准则可以同时确定a、b、c、d、e、f、gj和噪声分量振幅,即选择不同的噪声模型,确定各噪声分量的大小,使得坐标序列的残差v与其协方差的联合概率密度值,即式(6)达到最大,等价于联合概率密度函数值的对数,即式(7)达到最大。
lik(v,C)=1/((2π)N/2(detC)1/2)exp(-0.5vTC-1v).(6)
ln[lik(v,C)]=-0.5[ln(detC)
+vtC-1v+Nln(2π)].(7)
对于振幅为a,数据采样间隔为T,观测数据个数为n的纯白噪声过程,其估计速率的方差为
σ2r=(c2)/(T(n-1)),n>1.(8)
对于振幅为b,数据采样间隔为T,观测数据个数为n的闪烁噪声过程,有
σ2r=(9b2)/(16T2(n2-1)),n>1.(9)
对于振幅为c,数据采样间隔为T,观测数据个数为n的随机漫步噪声过程,有
σ2r=(c2)/(T(n-1)),n>1.(10)
可见,速度估计的方差与噪声类型、振幅、采样频率及数据个数有关,噪声类型在很大程度上影响了测站速度的不确定度(估计误差)。
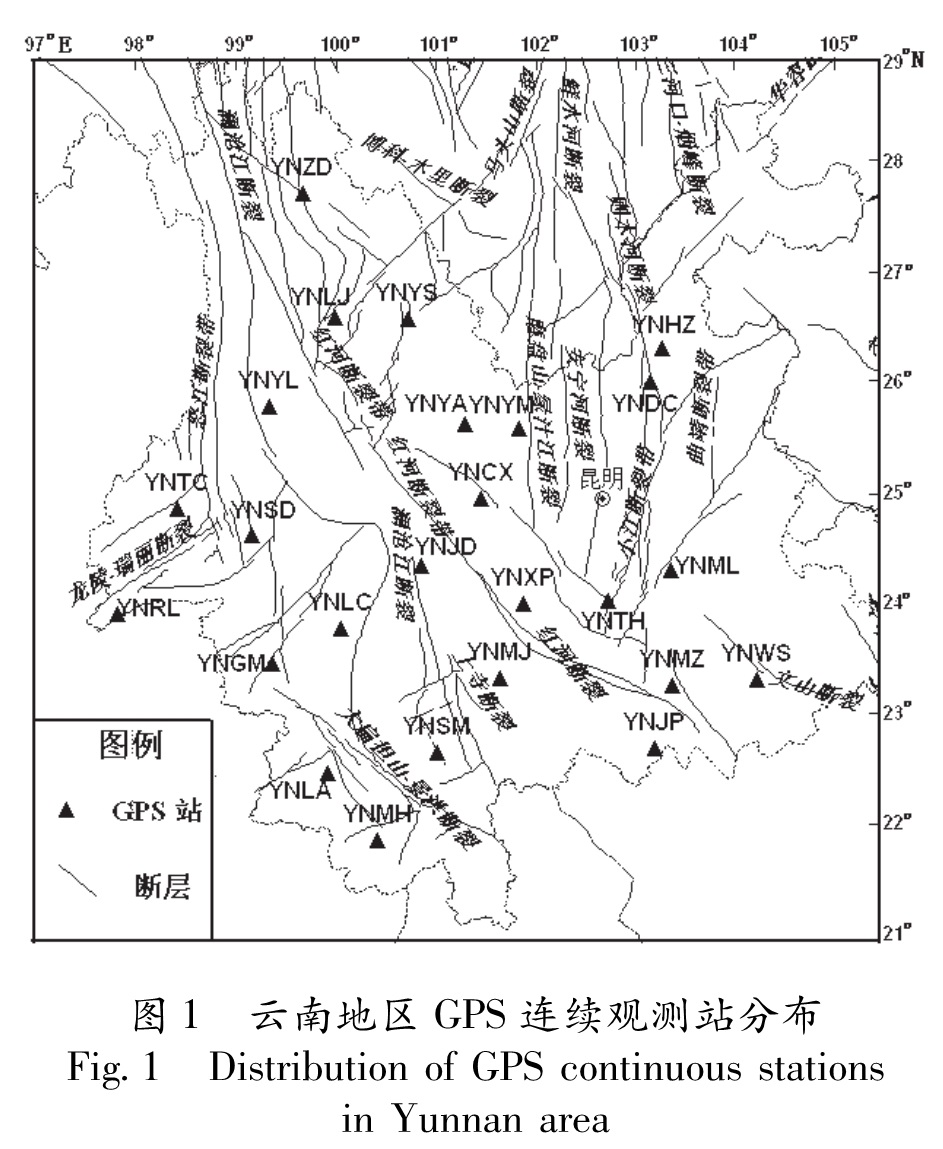
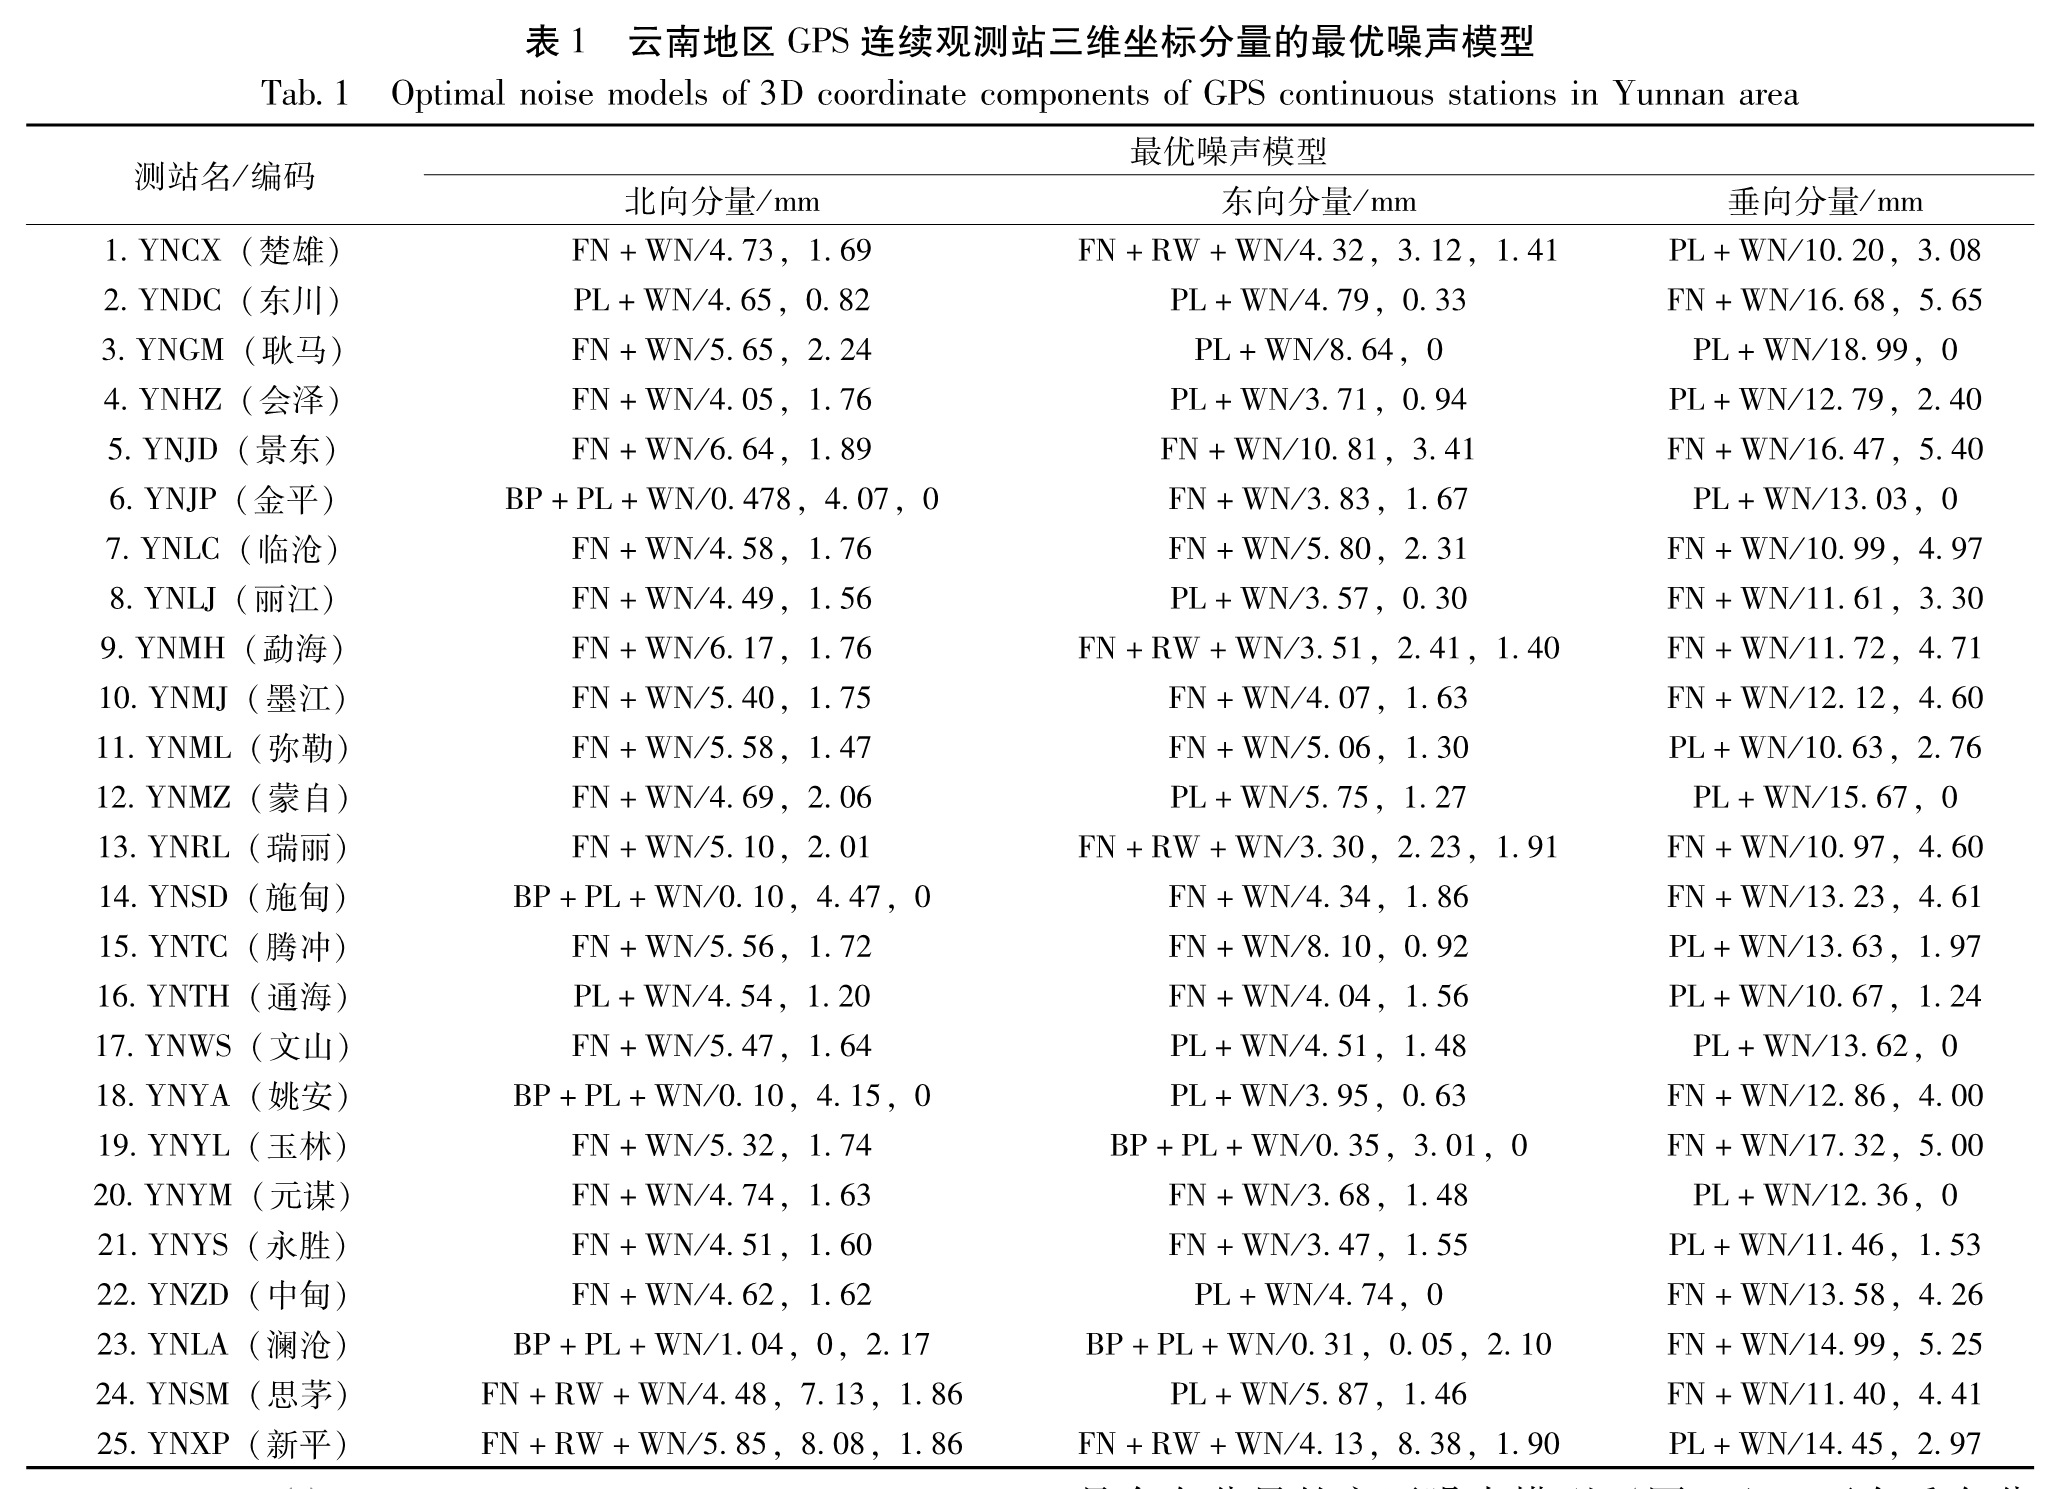
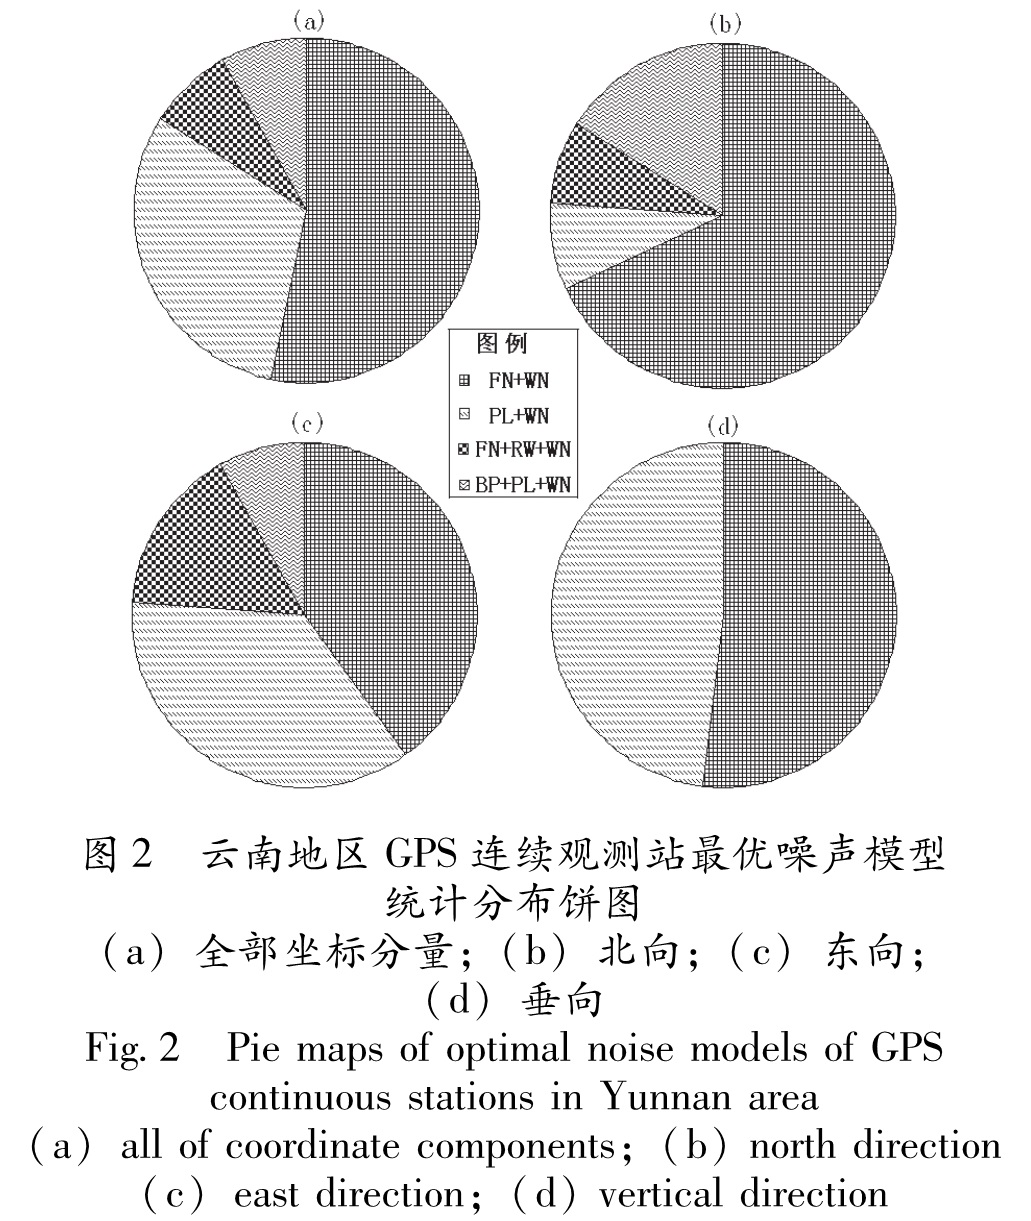
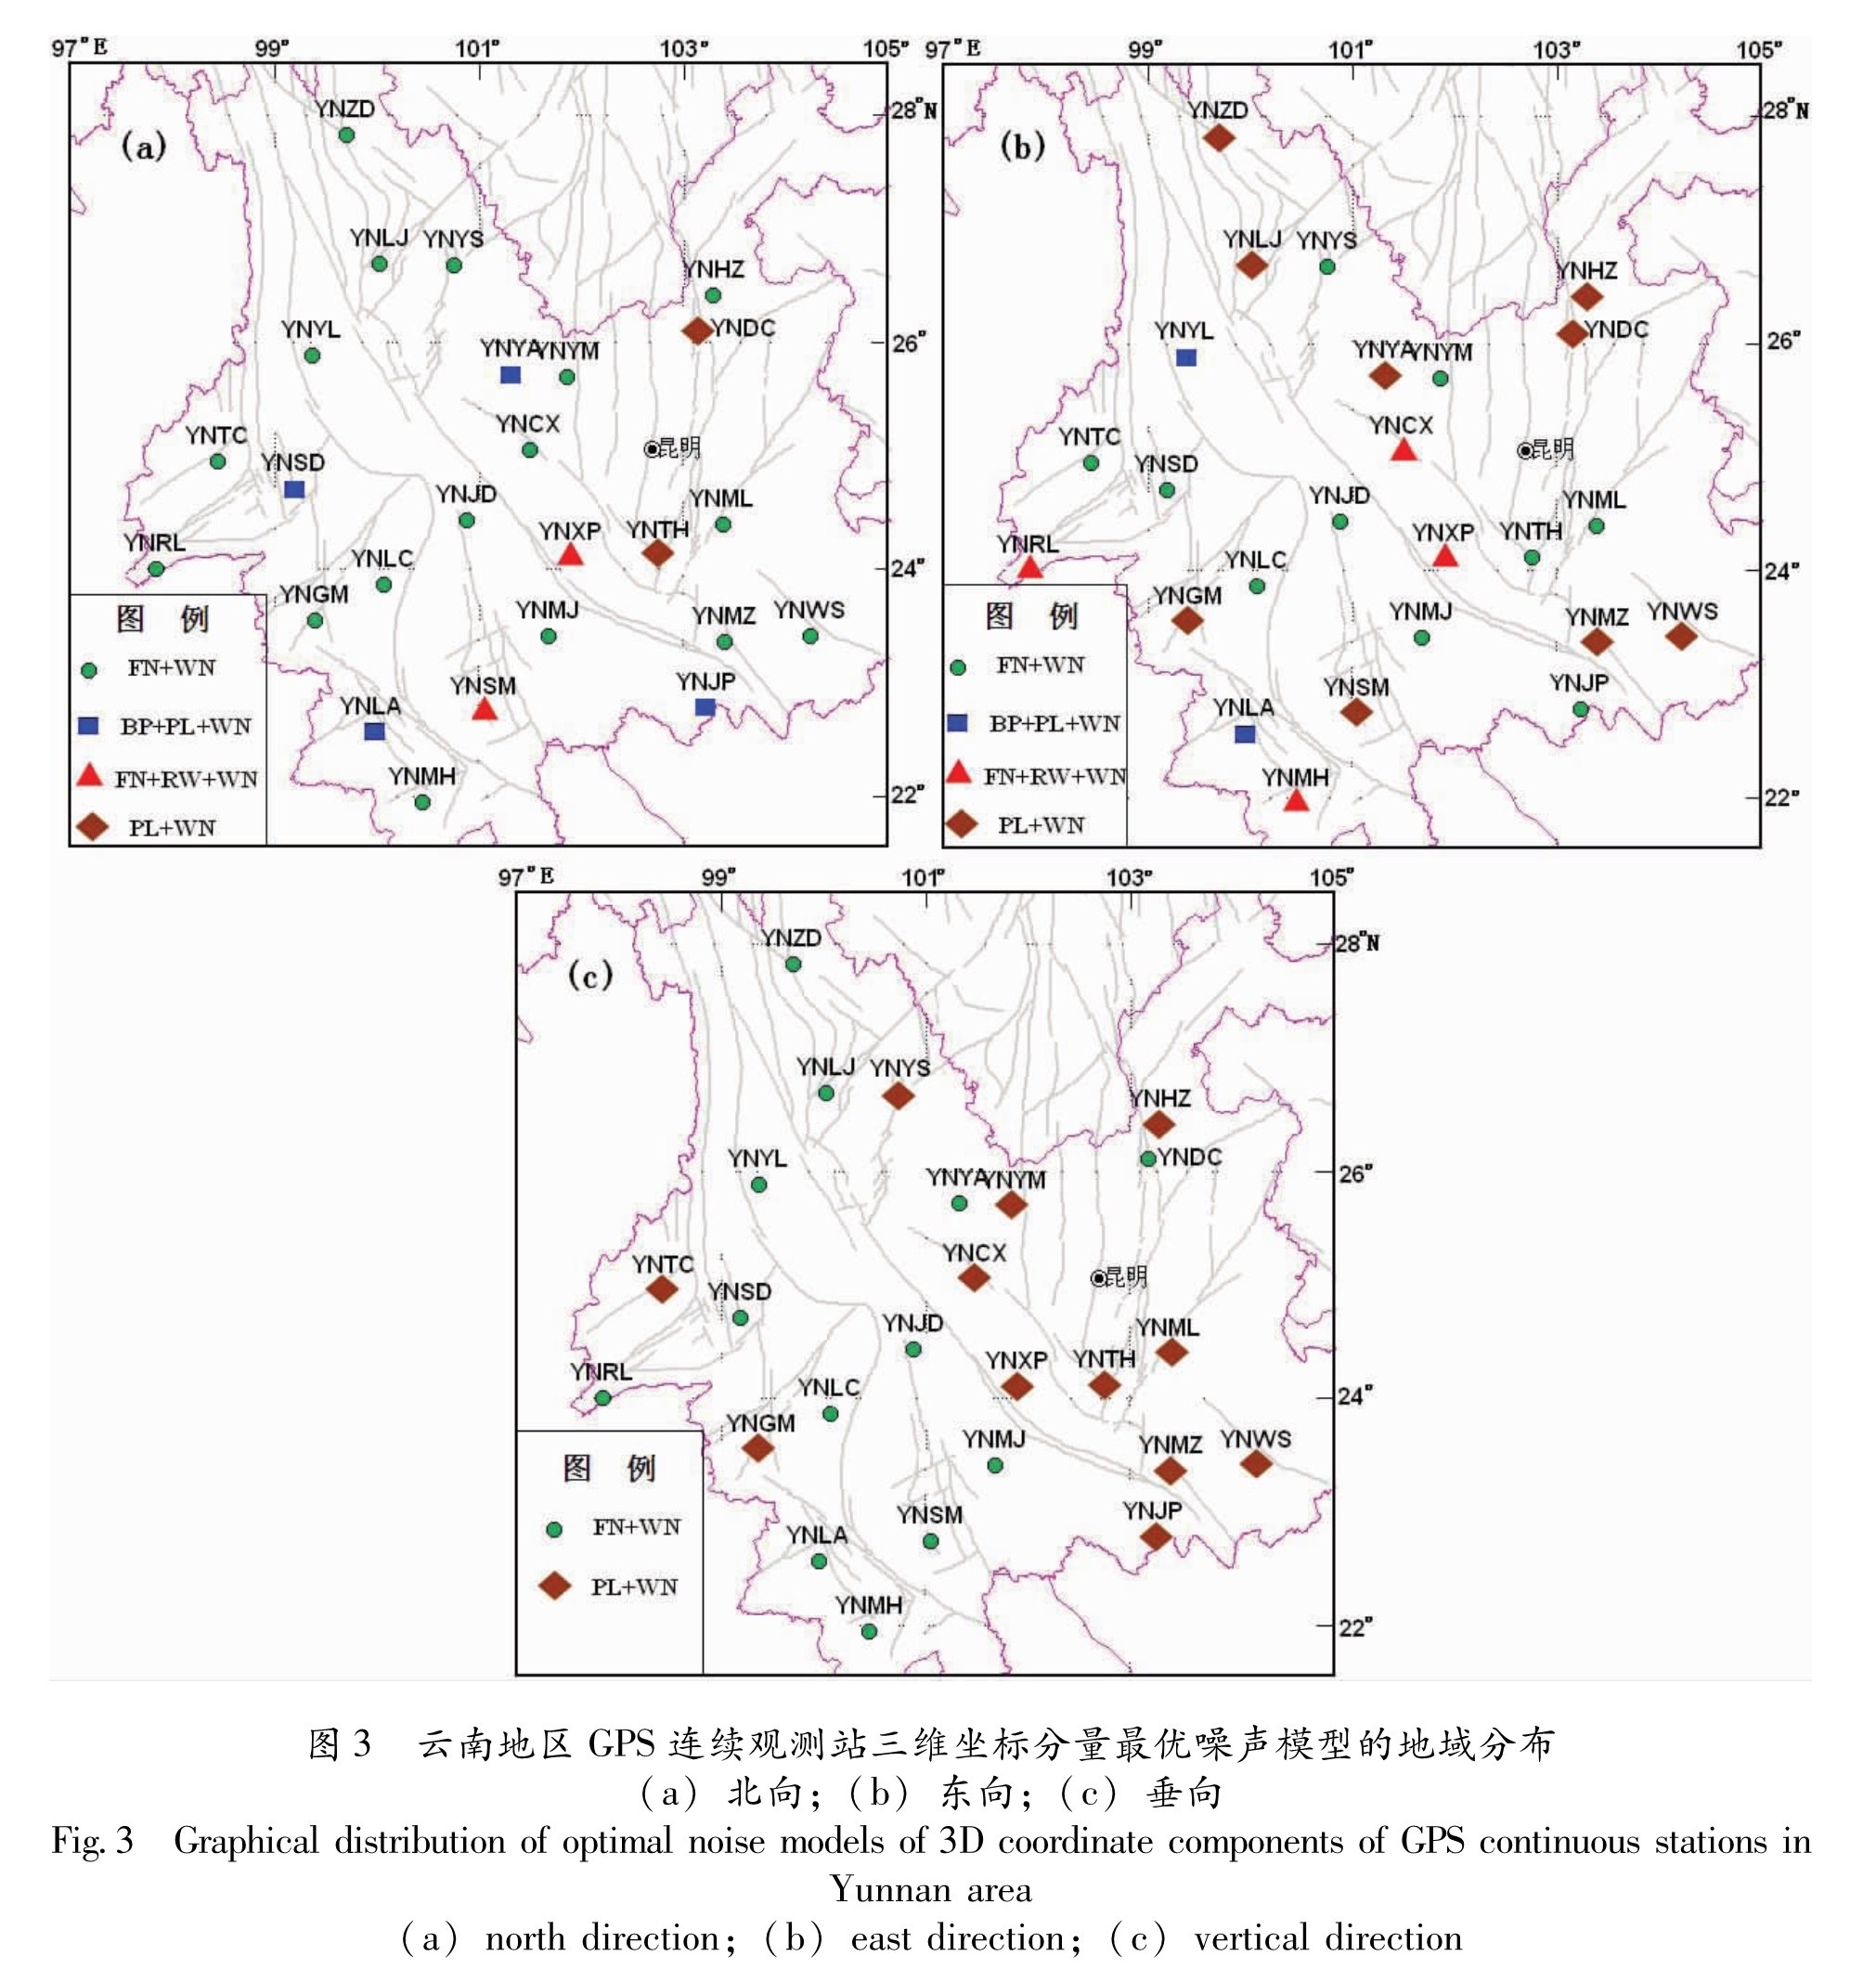
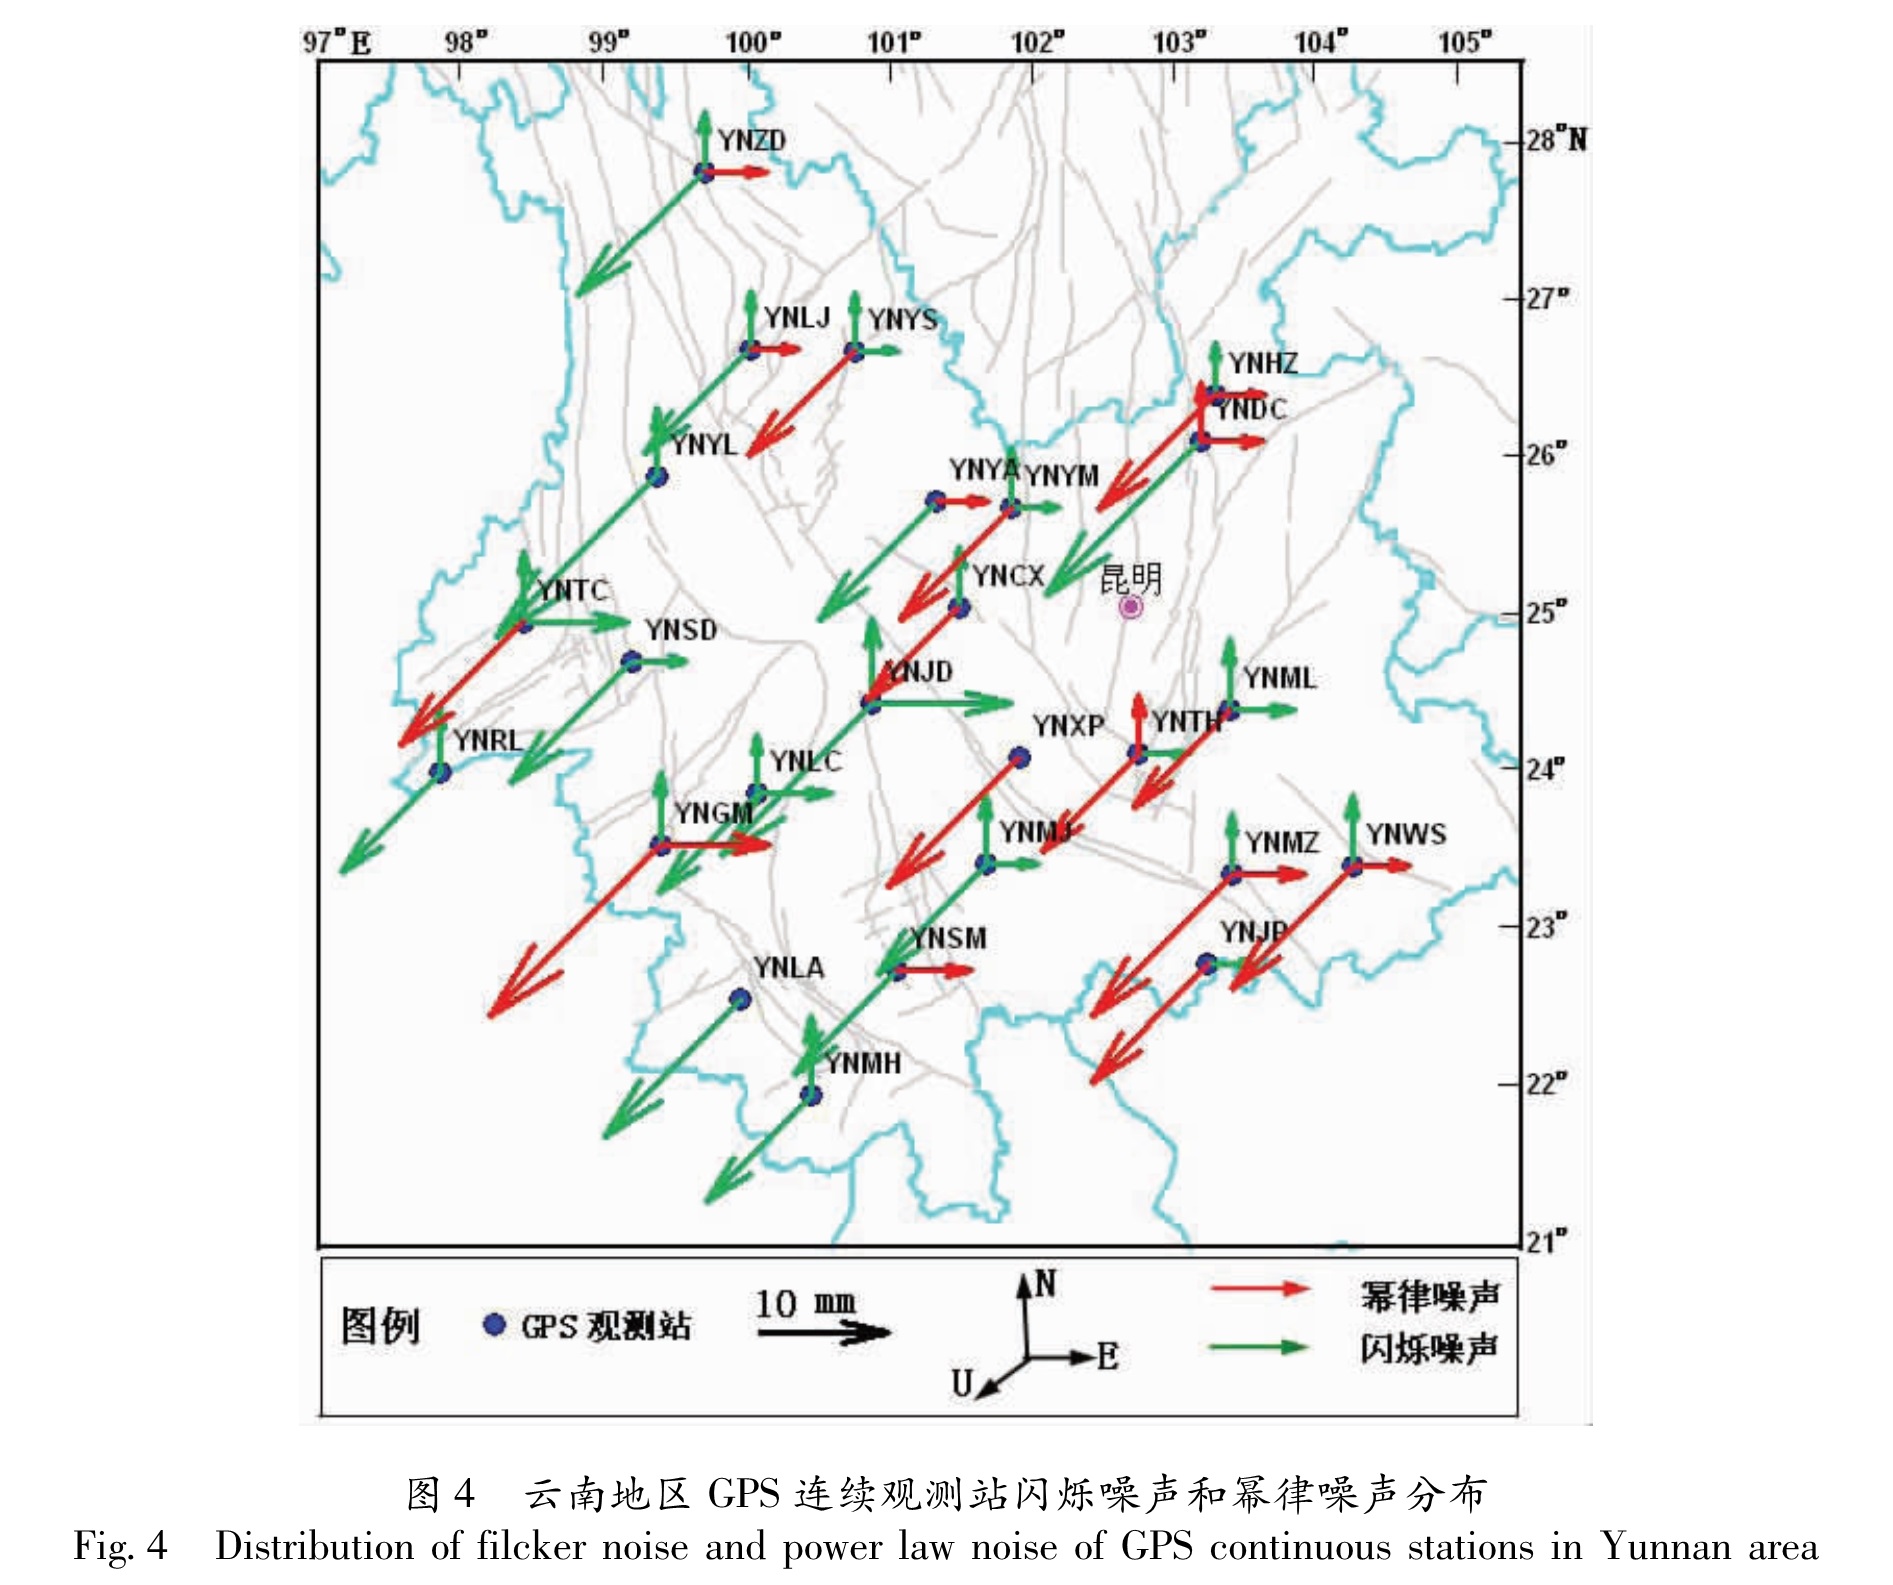
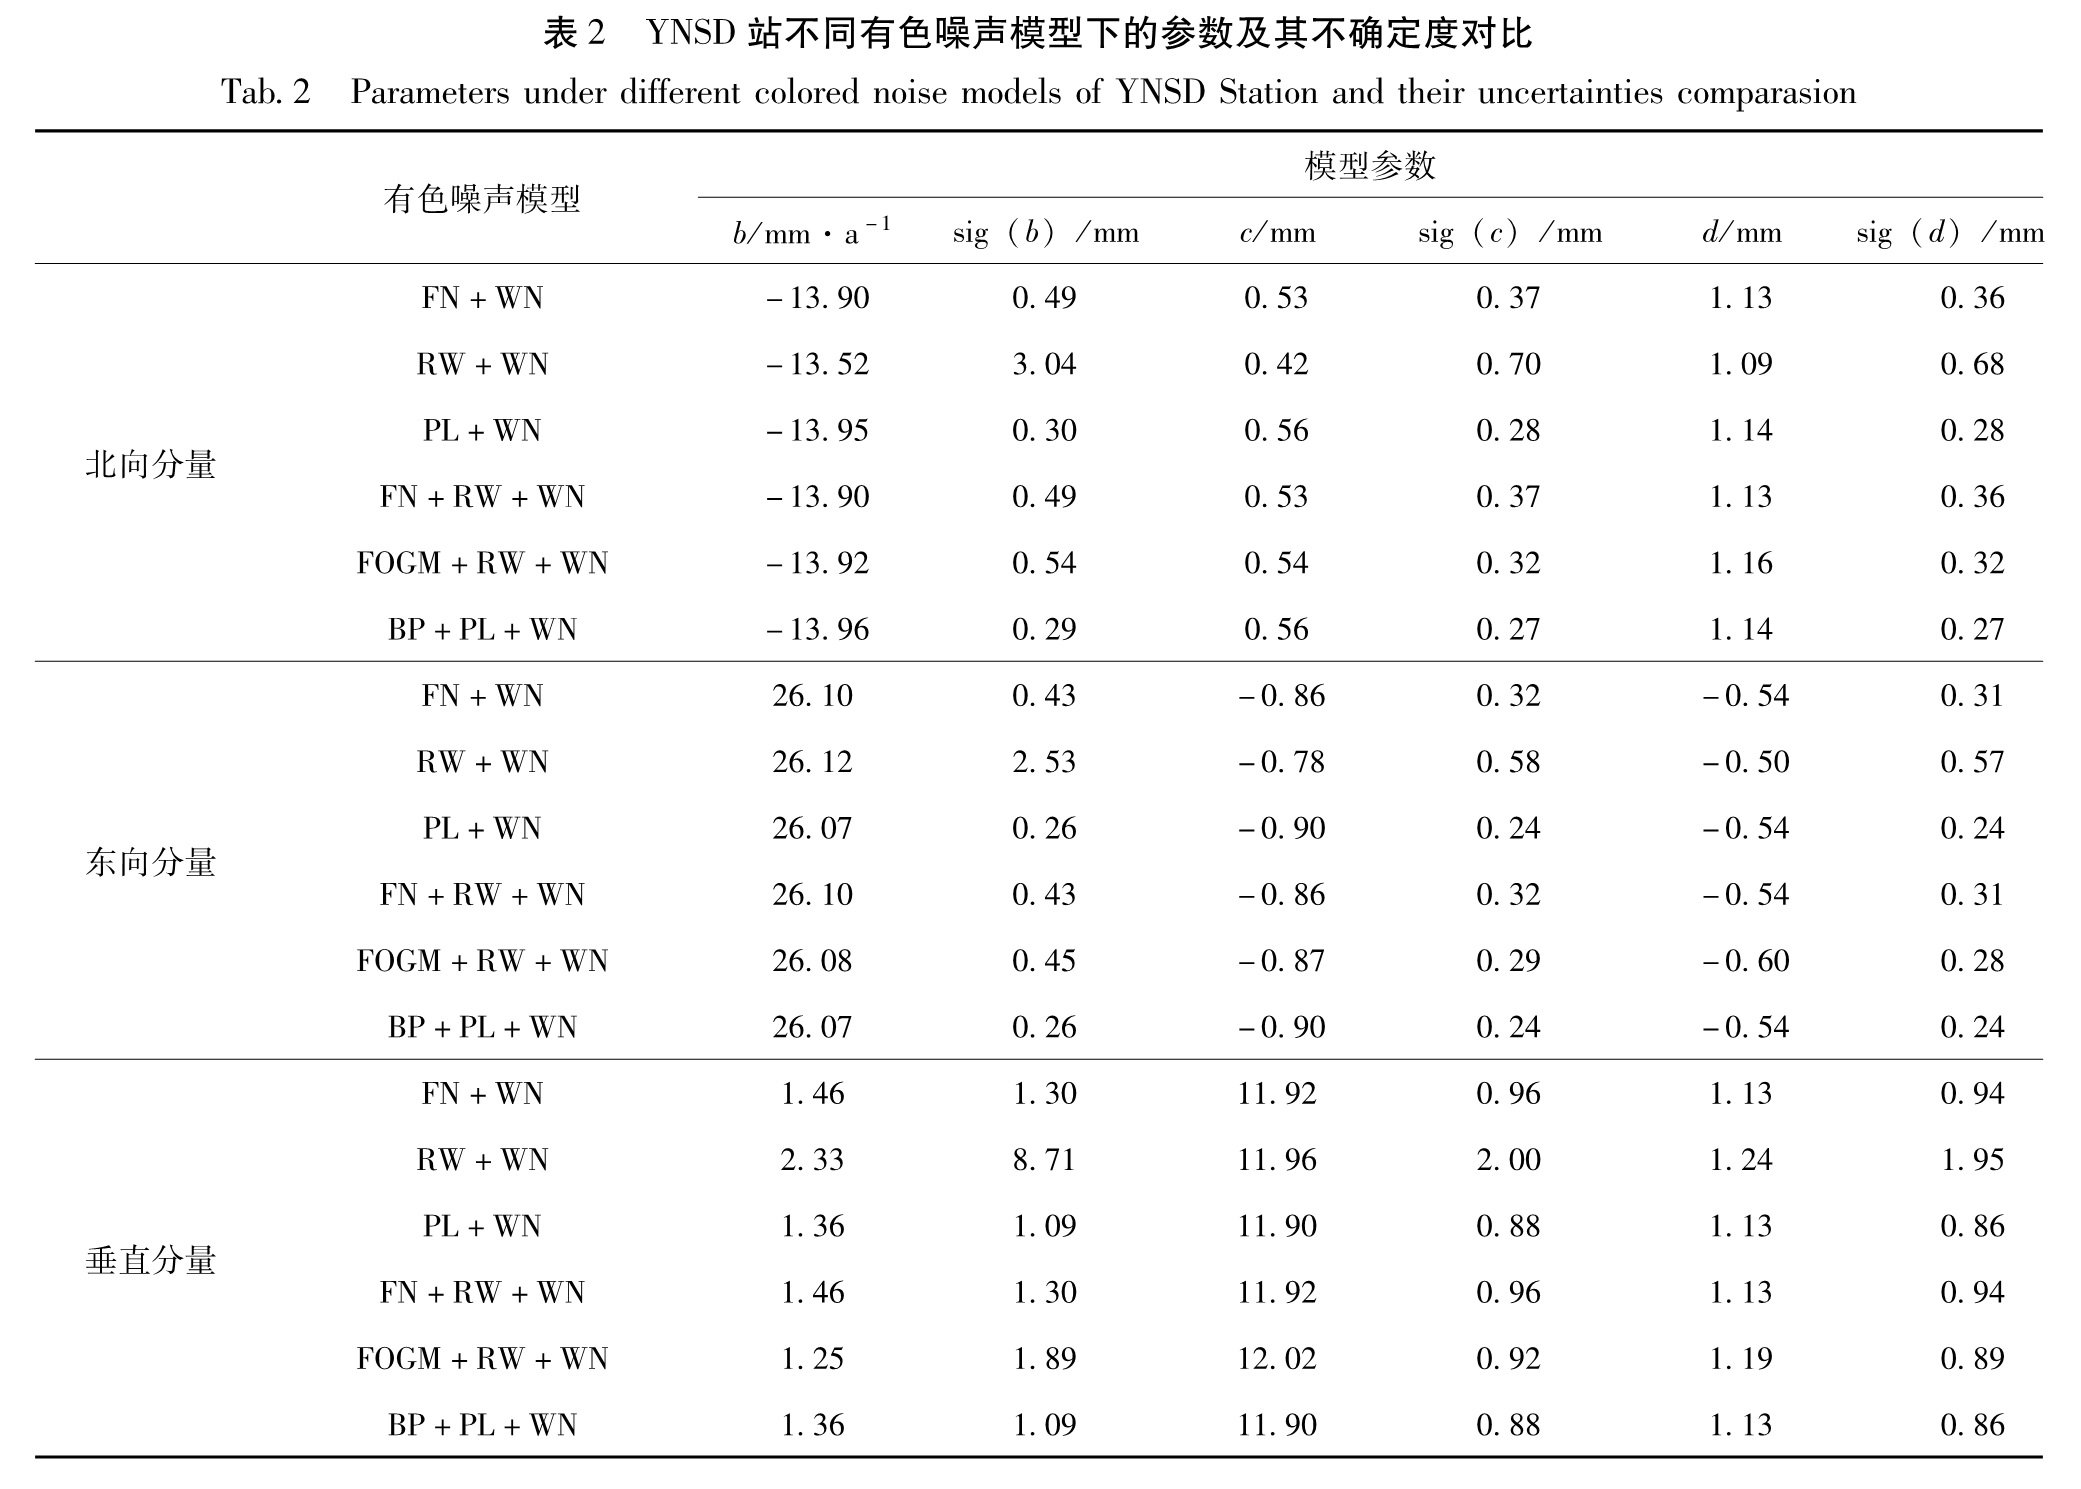
本文选取FN+WN(闪烁+白),RW+WN(随机漫步+白),FN+RW+W N(闪烁+随机漫步+白),PL+W N(幂律+白),FOGM+RW+WN(一阶高斯马尔科夫+随机漫步+白)以及BP+PL+WN(带通+幂律+白)共6种噪声模型,采用CATS软件(Williams,2008)对云南地区2010年新增建的25个陆态网络GPS基准站三维站坐标时间序列进行噪声分析。
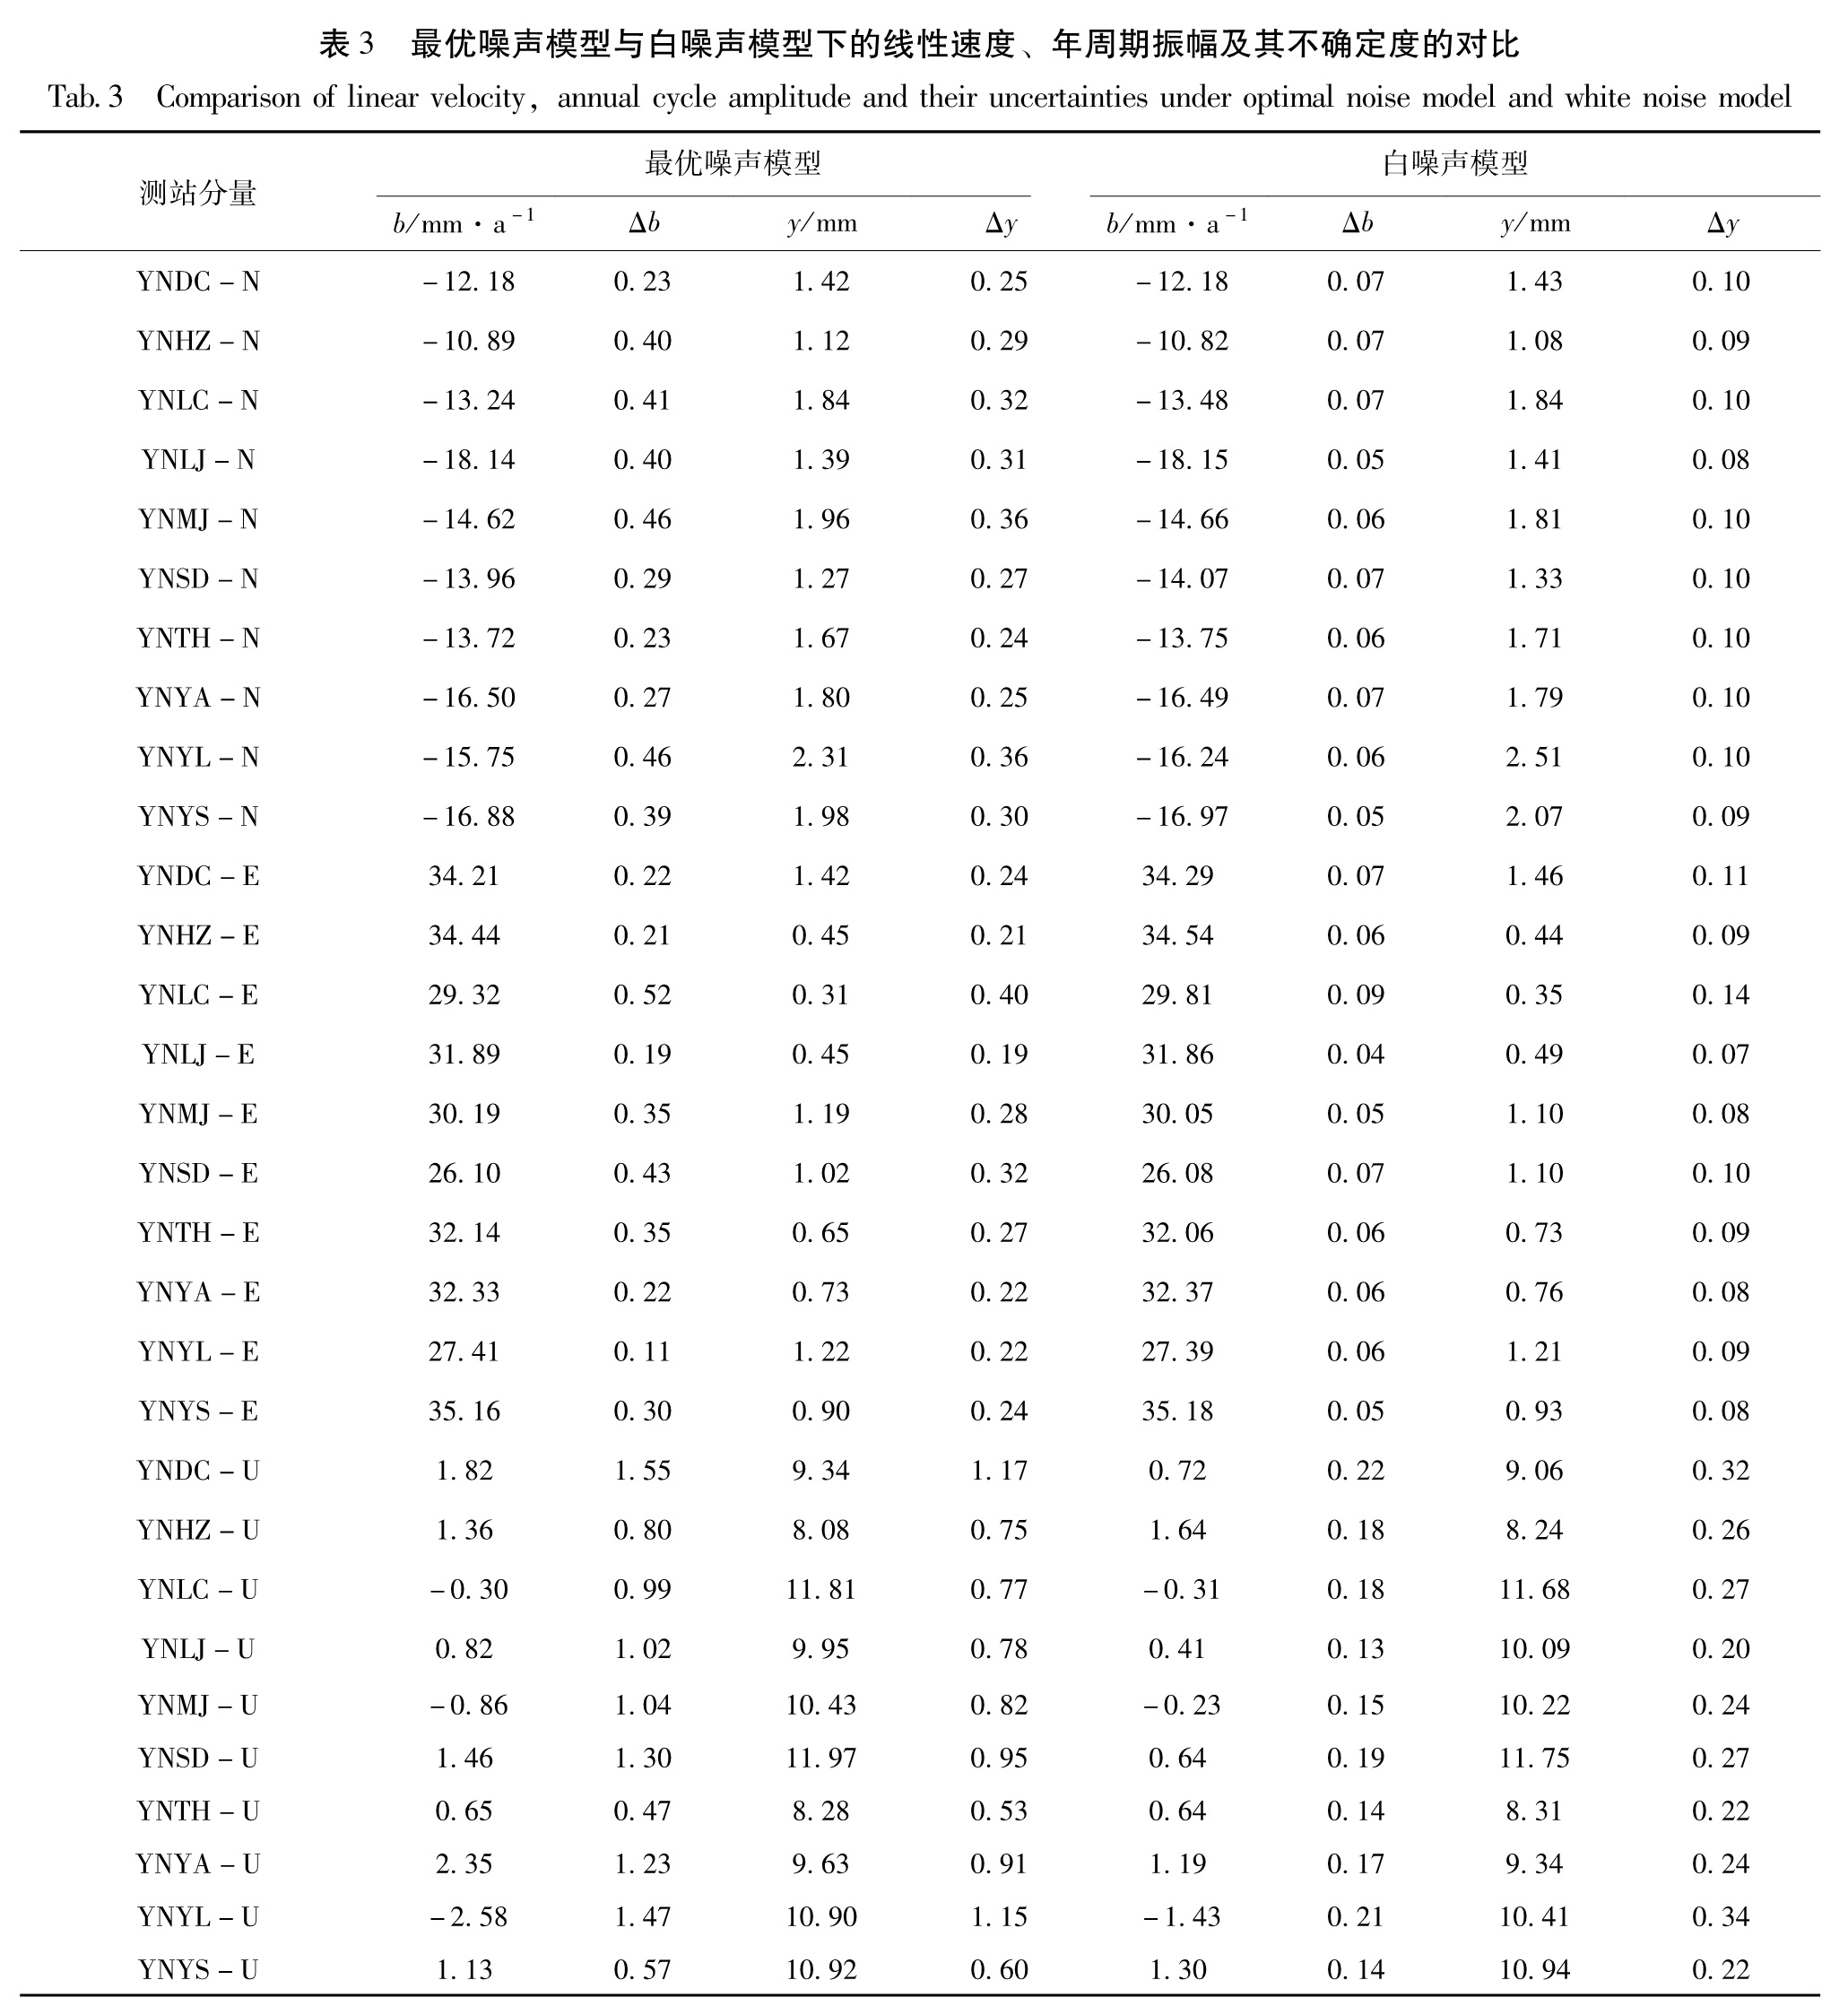
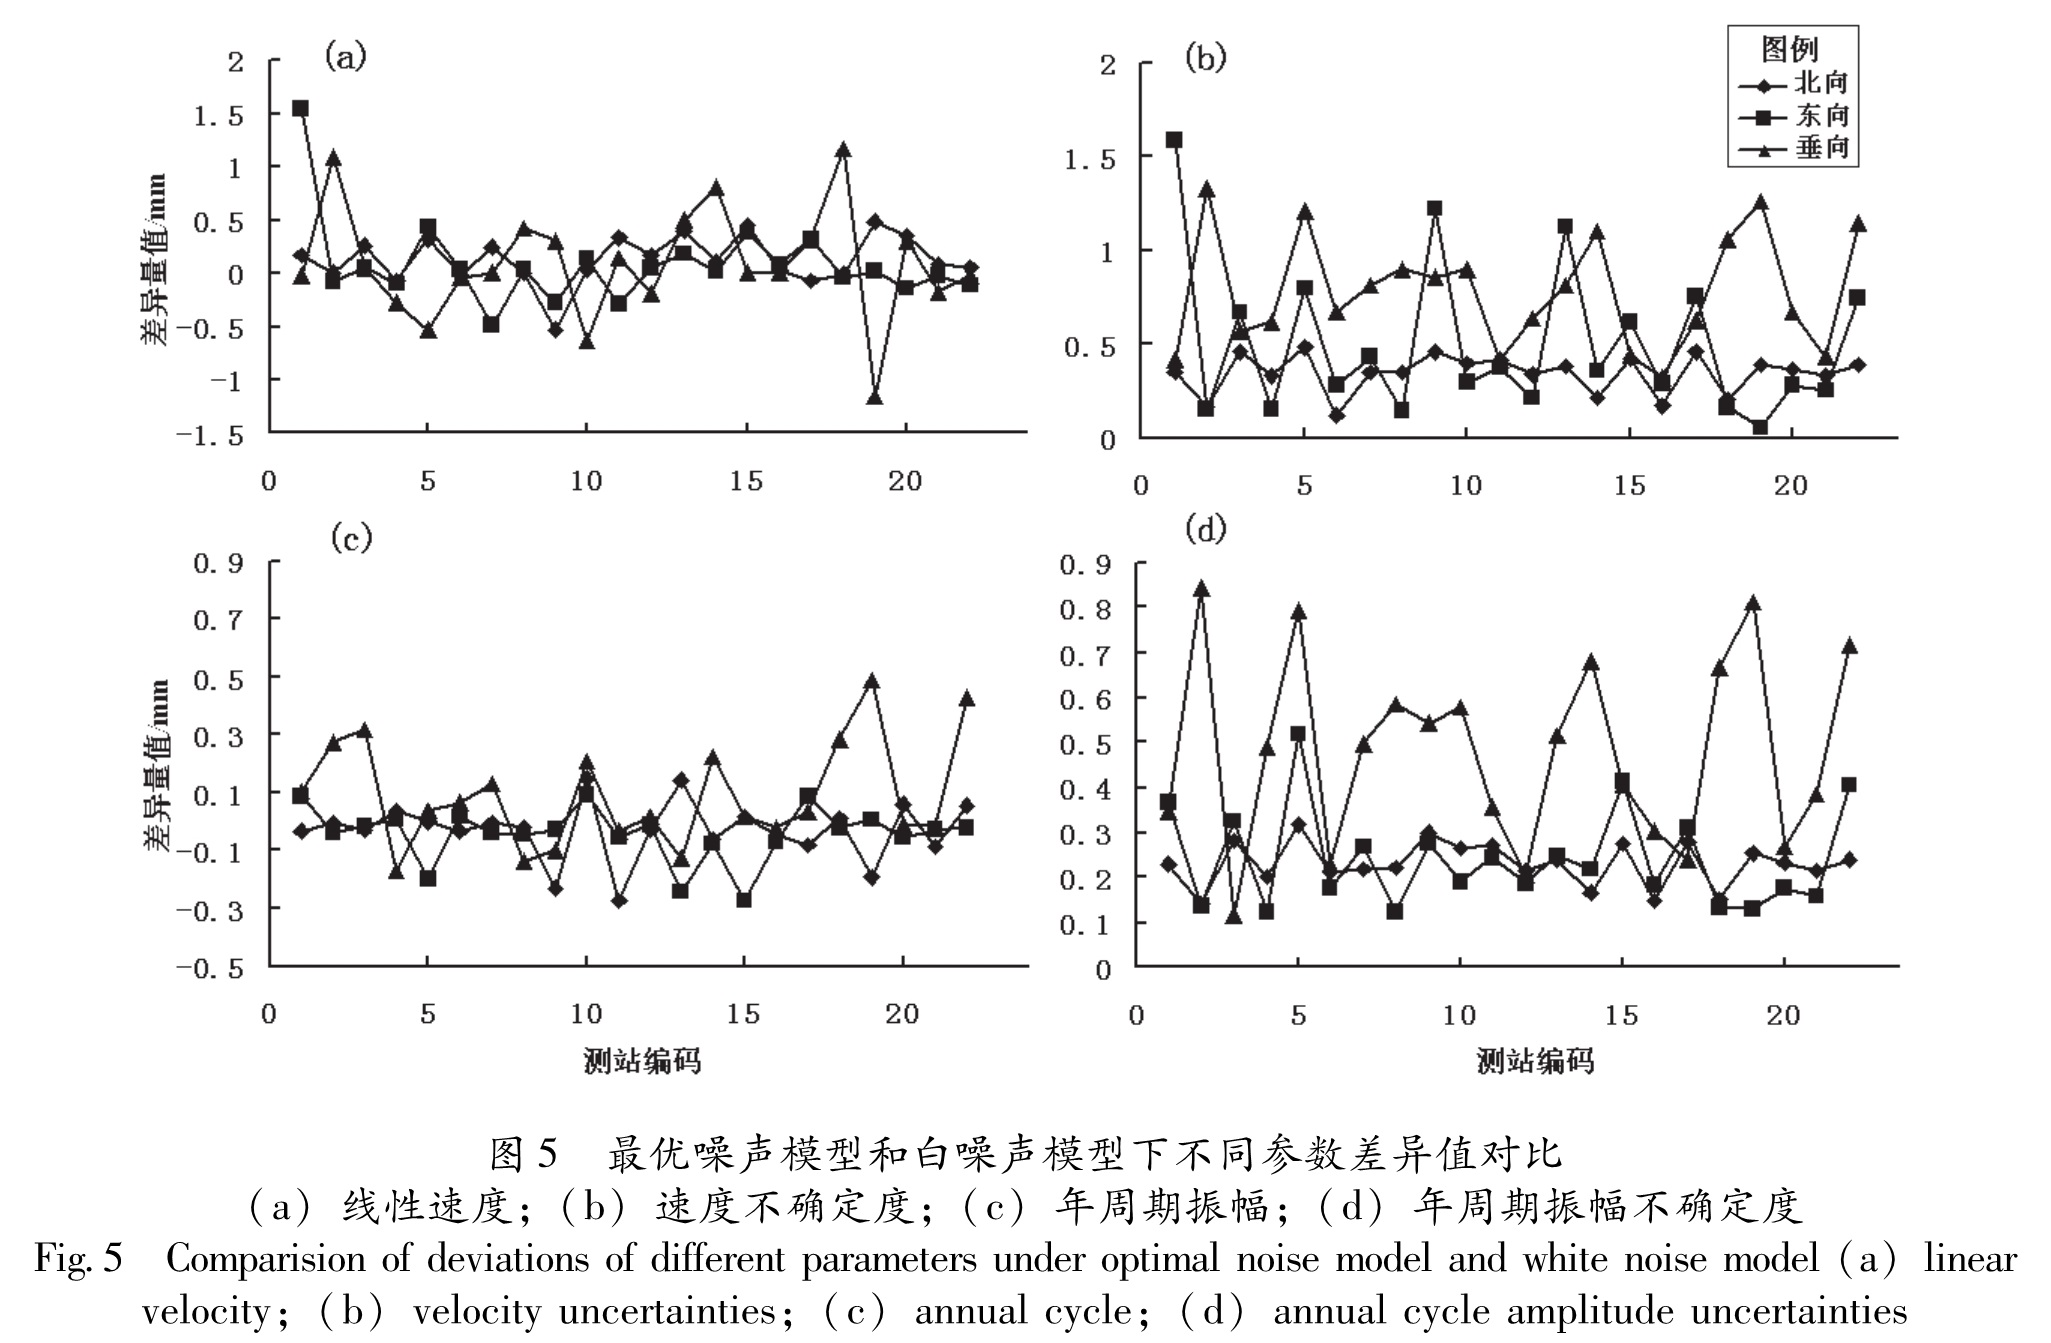
根据极大似然估计原理,不同的噪声模型组合将得到不同的极大似然对数值,即式(7),该数值越大,结果越可靠。应选择估值最大的模型作为最优噪声模型(Langbein,Johnson,1997; Mao et al,1999; Nikolaidis,2002)。然而,噪声模型包含的未知参数越多,其MLE值越大。蒙特卡罗模拟实验表明:95%的显著水平下,当两种噪声模型的MLE之差大于3.0时,2种模型具有可区分性(Langbein,2008; Williams,Willis,2006)。为了确保结果的可靠性,不能简单选择MLE值较大的模型作为最优噪声模型。本文时间序列最优噪声模型的确定采用Langbein(2004,2008)提出的保守估计准则。