基金项目:云南省地震局地震科技专项基金项目(ZX2016-01、ZX2015-01)、国家自然科学基金项目(41574059、41474048)以及云南省陈颙院士工作站专项经费(2014IC007)共同资助.
(Yunnan Earthquake Agency,Kunming 650224,Yunnan,China)
the Ludian earthquake; background noise; autocorrelation; relative wave velocity variation
备注
基金项目:云南省地震局地震科技专项基金项目(ZX2016-01、ZX2015-01)、国家自然科学基金项目(41574059、41474048)以及云南省陈颙院士工作站专项经费(2014IC007)共同资助.
利用鲁甸MS6.5地震震区及其周边的5个台站所记录的2013年1月至2015年12月三分量地震背景噪声数据,在不同频带内计算自相关格林函数,通过30天滑动叠加获得当前格林函数,对整个研究时段格林函数长时间叠加得到参考格林函数。进一步对当前格林函数和参考格林函数分别采用移动窗互谱、伸缩技术计算各台站相对波速变化,利用计算结果研究鲁甸地震前后波速变化特征。结果 表明:移动窗互谱法与伸缩法测量得到的相对波速变化趋势较为一致; 0.2~0.5 Hz频带范围内测量的相对波速变化对介质的敏感深度约为4 km,具有较强的年变趋势,鲁甸地震及永善地震发生后各台站呈现出较显著的同震波速变化,表现为明显的波速下降,其中ZAT台(昭通)、YAJ台(盐津)波速下降最大,达0.06%。整个研究时段波速变化呈现出“扰动-地震-降低-恢复抬升-地震-降低-恢复-扰动”的总体特征。0.5~1 Hz频带测量结果,未观测到明显的同震波速变化,但可见一定的季节性变化特征。
Firstly,using three component seismic background noise data recorded by 5 seismic stations located around the Ludian MS6.5 earthquake area from Jan.2013 to Dec.2015,we calculated autocorrelation Green function in different frequency.Secondly,we obtained the “Current Green function” by the stacking of autocorrelation Green function by sliding window with 30 days as window and 1 day as step and the “Referent Green function” by the stacking of autocorrelation Green function in the whole study time.Finally,based on “current Green function” and “referent Green function”,we calculated the relative wave velocity variation of each station by Moving Window Cross Spectrum(MWCS)and Stretching technology to analyze the relative variation characteristics of wave velocity before and after the Ludian MS6.5 earthquake.The results show that the variation of relative wave velocity by two methods was consistent well.The sensitive depth of the measured relative wave velocity in 0.2~0.5 Hz to the medium is about 4 km,and the wave velocity have a strong annual variation trend.After the Ludian earthquake and the Yongshan earthquake,the coseismic wave velocity variation of stations is significant,which showed as a significant decrease,and the wave velocity of Zhaotong(ZAT)and Yanjin(YAJ)Stations decreased reached 0.06%.The wave velocity variation in the whole study period shows the overall characteristics of “disturbance-earthquake-decrease-recovery and uplift-earthquake-decrease-recovery-disturbance”.We didn't observe obvious wave velocity changes,however,some seasonal variation characteristics are shown in the frequency of 0.5~1 Hz measuring results.
引言
据中国地震台网测定,2014年8月3日16时30分云南省昭通市鲁甸县发生MS6.5地震,震中位置(27.1°N,103.3°E),震源深度12 km。震害调查表明本次地震烈度高达Ⅸ度,等震线长轴呈NW-NNW向。虽然此次地震震级不大,但给鲁甸及周边地区造成重大人员伤亡和财产损失,因而引起国内多个研究机构和研究小组的关注。鲁甸地震精定位给出震中位置(27.11°N,103.35°E),余震序列主要呈不对称的以SE向和SW向为主的倒“L”形优势分布,震源深度约为13~15 km(王未来等,2014; 张广伟等,2014; 房立华等,2014),震源机制参数研究显示该地震为走滑型,节面Ⅰ近南北向:走向162°/倾角70°/滑动角-14°,节面Ⅱ近东西向:走向257°/倾角77°/滑动角-159°(张广伟等,2014; 张勇等,2014,2015); 依据野外调查、主余震条带展布、震源机制解、地震烈度长轴方位等资料判定鲁甸6.5级地震属于陡倾角左旋走滑型地震,发震断层为NNW向包谷垴—小河断裂(徐锡伟等,2014; 房立华等,2014; 金明培等,2014; 何骁慧等,2015); 震源破裂过程及破裂特征研究表明鲁甸地震是在NW向主压应力与NE向主张应力相互作用下发生的以NNW向破裂为主的共轭破裂事件(张勇等,2014,2015; 程佳等,2016),其主震的发生对后续余震的分布及周边主要断层的活动有一定的影响(付芮等; 2015; 程佳等,2016年; 缪淼,朱守彪,2016)。鲁甸地震震后的研究主要集中在地震序列重定位、发震构造判定、震源机制、震源破裂及库伦应力变化等方面,而地震的孕育及发生常伴随着震源区应力状态和介质属性的变化(Mooney,Ginzburg,1986),当地下介质应力积累超过地下岩石断裂强度时也就发生了地震。因此研究与地震相关的应力变化可帮助我们加深对地震孕育、发生和震后恢复过程的理解,也有助于地球动力学过程的研究。
研究地球内部结构及其物理性质变化的方法一般包括测量波速比(VP/VS)(Kondratenko,Nersesov,1962; Aggarwal et al,1973)、计算剪切波分裂变化(Crampin et al,1990)、尾波Q值测量(Jin,Aki,1986)、利用天然或人工的重复震源研究波速变化(Poupinent,1984; Furumoto et al,2001; 陈颙等,2007)、背景噪声监测(Shapiro,Campillo,2004; Sens-Schönfelder,Wegler,2006; Wegler et al,2009)等地震学方法。其中,地震背景噪声方法可以对地壳介质进行长期重复监测,该方法通过对两个台站记录到的背景噪声数据进行互相关计算获得经验格林函数(在极端情况下2个台站重合,互相关函数就转换为单台的自相关函数),当噪声记录足够长时,不同时段的格林函数波形可以保持较高的相似性,当介质的物理性质发生变化而引起介质波速变化时,这种变化可以通过对不同时段的经验格林函数波形进行尾波干涉测量获得(Sens-Schönfelder,Wegler,2006; Sens,2011)。该方法具有较天然震源更高的时空分辨率、较人工震源更经济等优势,所以一经提出就得到了快速而广泛的应用。其应用领域涵盖火山监测(Sens-Schönfelder,Wegler,2006; Brenguier et al,2008b; Duputel et al,2009; Mordret et al,2010; Anggono et al,2012)、同震波速变化(Wegler,Sens-Schönfelder,2007; Brenguier et al,2008a; Wegler et al,2009; Mordret et al,2010; Chen et al,2010; Cheng et al,2010; 刘志坤,黄金莉,2010; 赵盼盼等,2012; Liu et al,2014; 王俊等,2016),甚至利用其分析月球表面波速变化(Sens-Schönfelder,Larose,2008)等。
相较于利用互相关格林函数进行波速变化测量,自相关格林函数由于激发和接收为同一台站,可以避免钟差的影响。同时自相关格林函数尾波部分也包含了散射波场的信息,对台站附近的介质变化更敏感,能得到较浅层介质变化的波速响应(Ugalde et al,2014)。因此,本文将利用背景噪声自相关方法结合尾波干涉思想测量鲁甸地震前后2013年1月至2015年12月震区及周边波速的变化,分析其时空变化规律。
1 数据选取和研究方法
2 计算结果
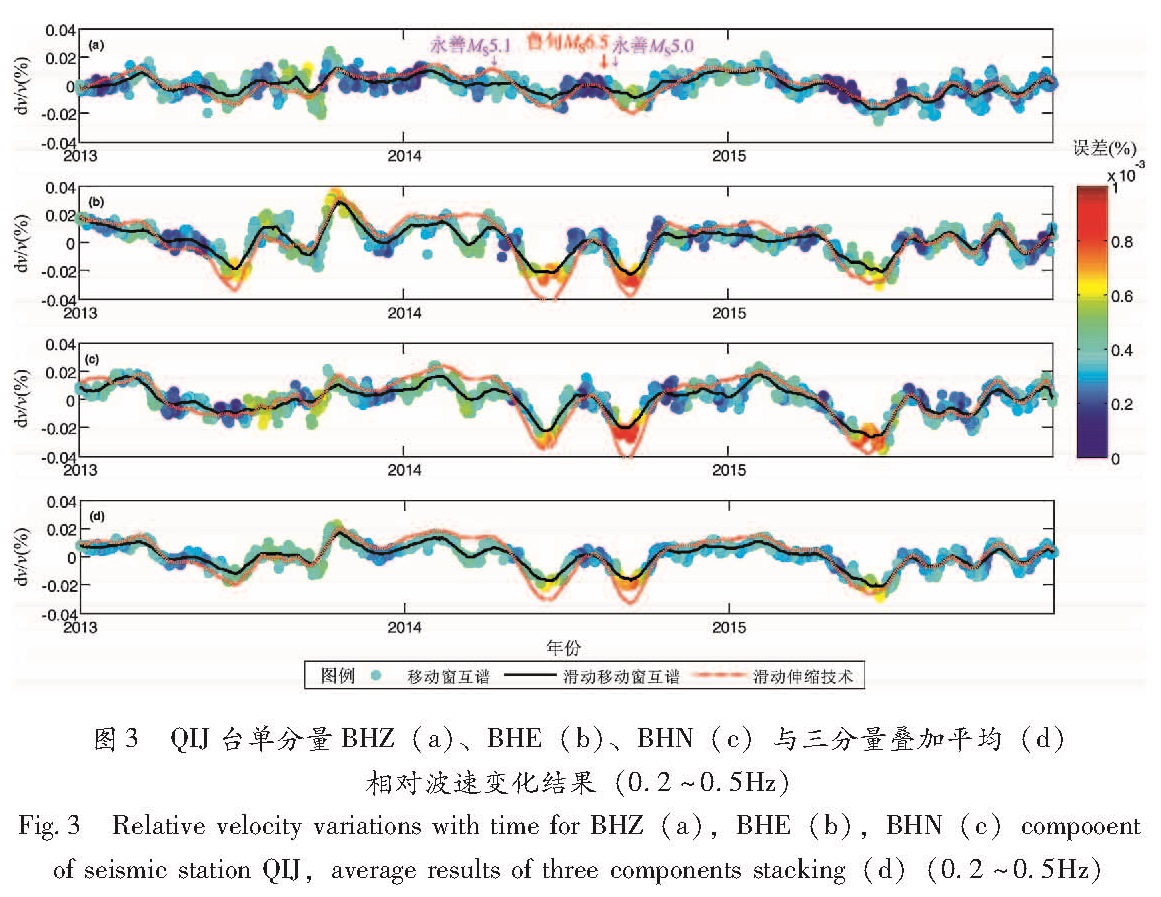
分别采用上述两种相对波速变化测量技术,对鲁甸震区及周边区域布设的QIJ等5个台站所记录的背景噪声数据进行计算。图3为QIJ台在0.2~0.5 Hz频带范围分别使用单分量(图3a~c)数据计算所得结果与三分量叠加平均(图3d)结果。从图中可见:一是利用移动窗互谱法和伸缩法测量所得结果具有较好一致性趋势,只是伸缩法测量结果较移动窗互谱法结果存在一个速度的增加,Zhan等(2013)将这一速度的增加归因于伸缩法的应用所引起的视速度,该现象在Ugalde等
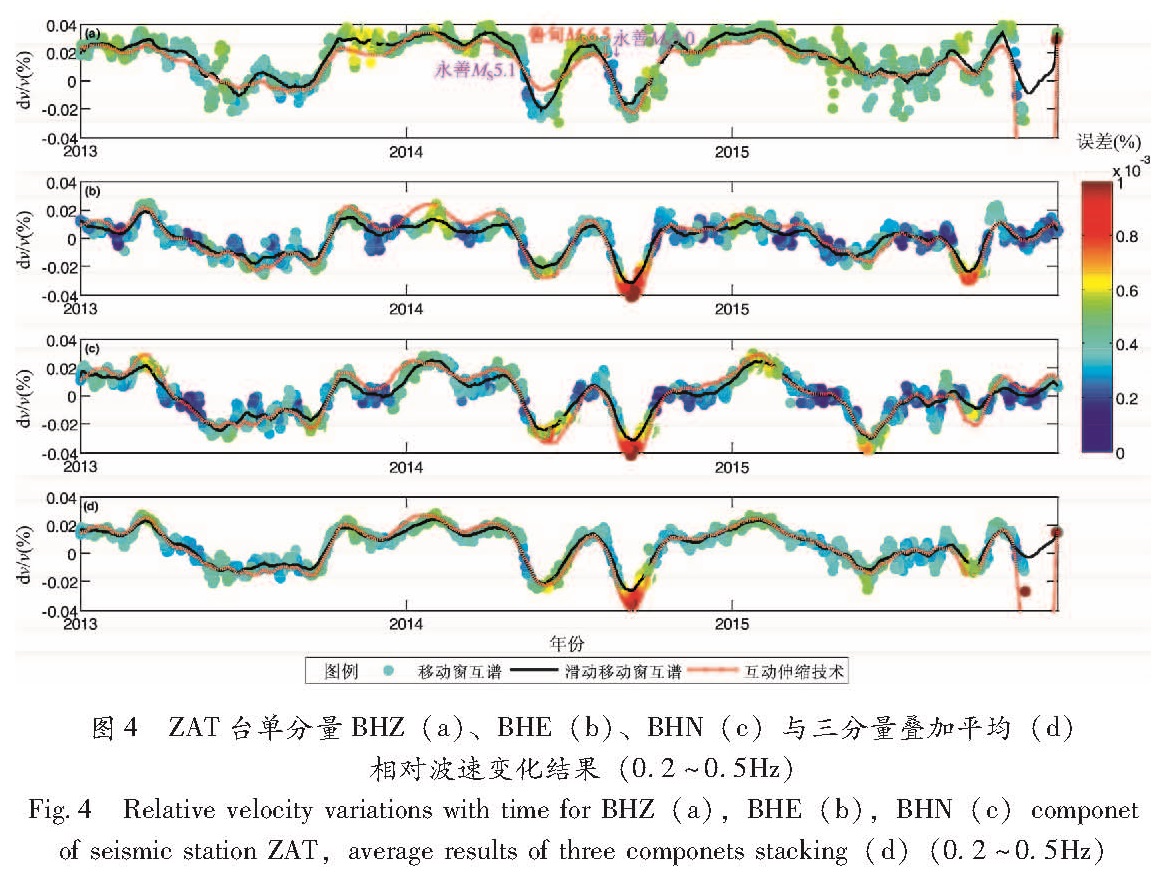
(2014)的研究中也有体现; 二是三分量叠加结果较单分量结果波速扰动更加平稳,测量误差更小,同震波速变化更清晰准确,这是由于不同分量相关函数尾波对介质的变化响应是一致的,相关函数路径的多少会影响波速测量的精确性和稳定性(Roux,2009),当参与计算的相关函数增加时,其结果的精度和稳定性也就会相应提高。同样处理方法对ZAT台数据进行计算(图4),得到类似结果。
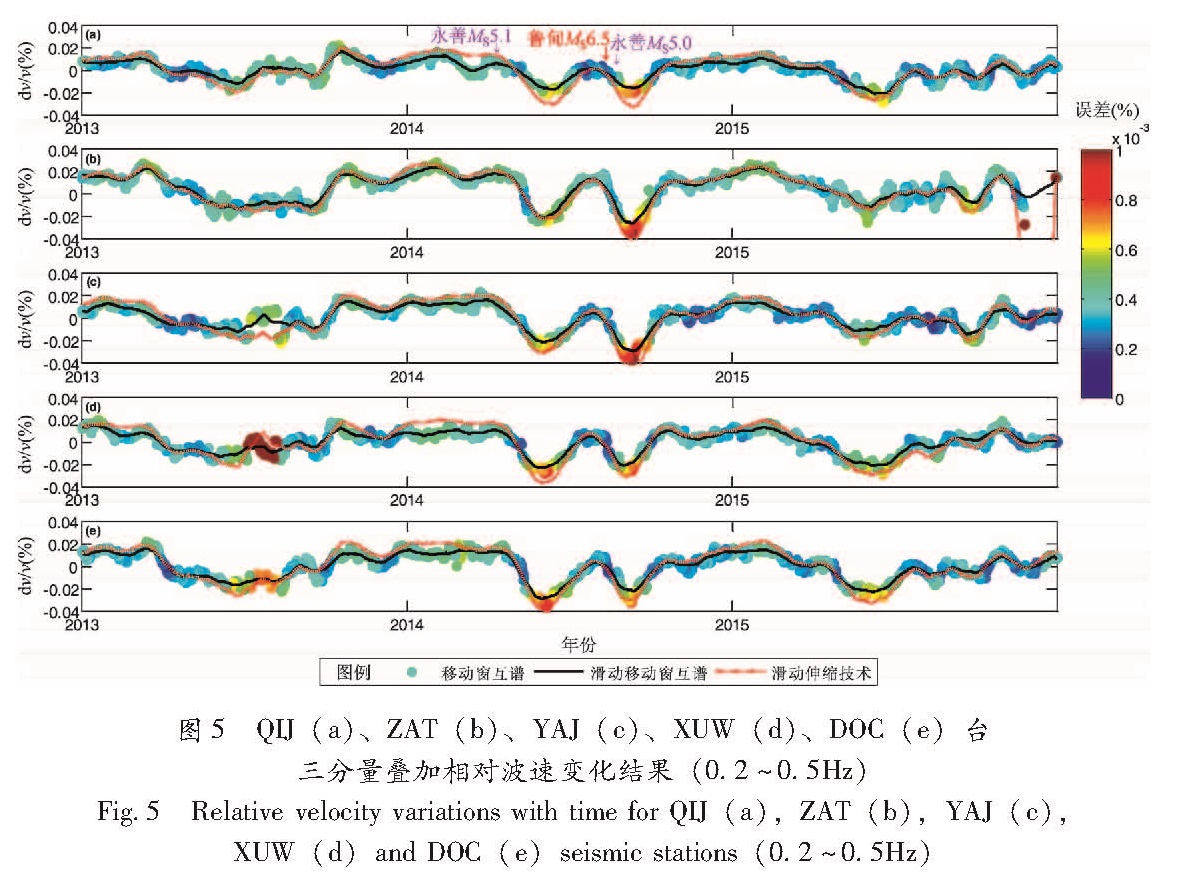
图5给出了研究区内5个台站分别利用移动窗互谱法(黑色实线)和伸缩法(红色虚线)计算得到三分量叠加经30天滑动平均所得相对波速变化结果(0.2~0.5Hz)。从图中可以看到,各台站在地震发生前(2013年)及震后(2015年)其相对波速变化在±0.02%范围内扰动,这一结果与Brenguier 等(2008a)对Parkfield地震前及Chen等(2010)对汶川地震前测量得到的波速扰动相似。2014年4月5日云南昭通永善5.1级地震发生后各台站的波速发生了不同程度的降低(0.04%左右),这种波速降低持续了近1个半月。随后各台站波速进入恢复抬升期,直至2014年8月3日鲁甸6.5级地震发生前。鲁甸6.5级地震及随后8月17日永善5.0级地震的发生导致各台站
图3 QIJ台单分量BHZ(a)、BHE(b)、BHN(c)与三分量叠加平均(d)相对波速变化结果(0.2~0.5Hz)
Fig.3 Relative velocity variations with time for BHZ(a),BHE(b),BHN(c)compooent of seismic station QIJ,average results of three components stacking(d)(0.2~0.5Hz)的波速变化较永善5.1级地震后又出现了一个急剧降低,该降低期持续较短(约1个月),最大波速降达0.06%(ZAT、YAJ),其波速降低值亦与
Brenguier 等(2008a)、Chen 等(2010)所测量结果基本一致。最大波速降出现在震后的时间与刘志坤和黄金莉(2010)计算的汶川地震、王俊等
图4 ZAT台单分量BHZ(a)、BHE(b)、BHN(c)与三分量叠加平均(d)相对波速变化结果(0.2~0.5Hz)
Fig.4 Relative velocity variations with time for BHZ(a),BHE(b),BHN(c)componet of seismic station ZAT,average results of three componets stacking(d)(0.2~0.5Hz)图5 QIJ(a)、ZAT(b)、YAJ(c)、XUW(d)、DOC(e)台三分量叠加相对波速变化结果(0.2~0.5Hz)
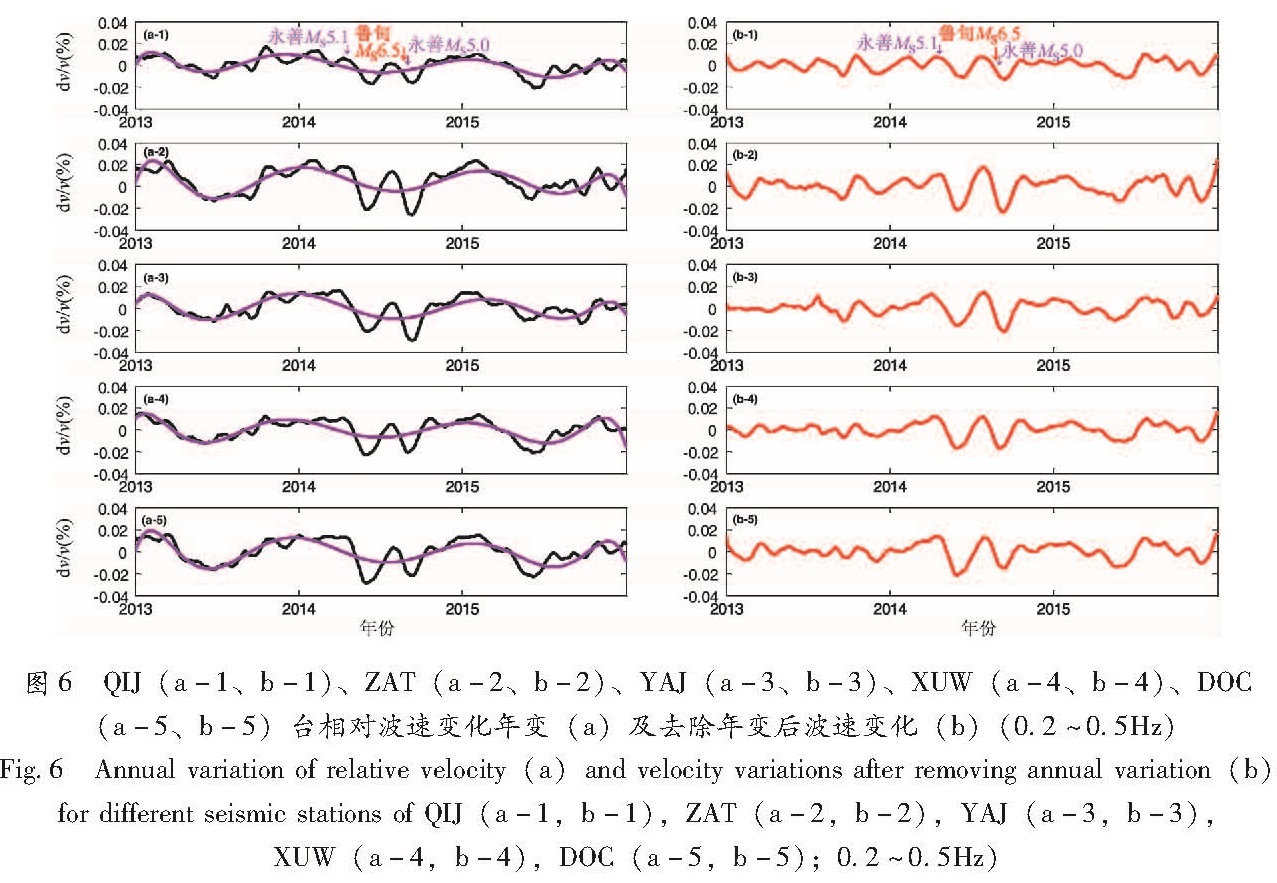
Fig.5 Relative velocity variations with time for QIJ(a),ZAT(b),YAJ(c),XUW(d)and DOC(e)seismic stations(0.2~0.5Hz)图6 QIJ(a-1、b-1)、ZAT(a-2、b-2)、YAJ(a-3、b-3)、XUW(a-4、b-4)、DOC(a-5、b-5)台相对波速变化年变(a)及去除年变后波速变化(b)(0.2~0.5Hz)
Fig.6 Annual variation of relative velocity(a)and velocity variations after removing annual variation(b) for different seismic stations of QIJ(a-1,b-1),ZAT(a-2,b-2),YAJ(a-3,b-3),XUW(a-4,b-4),DOC(a-5,b-5); 0.2~0.5Hz)(2016)计算的芦山地震最大波速降出现在震后1~4个月内相符。对于最大相对波速降没在震后立即出现,而是滞后一段时间的现象,则可能与余震的发生有关(王俊等,2016)。随后各台站相对波速进入了快速恢复期,到了2015年各台站波速变化恢复到了震前扰动状态。总的来看,波速随时间相对变化特征表现为:扰动-地震-降低-恢复抬升-地震-降低-恢复-扰动。
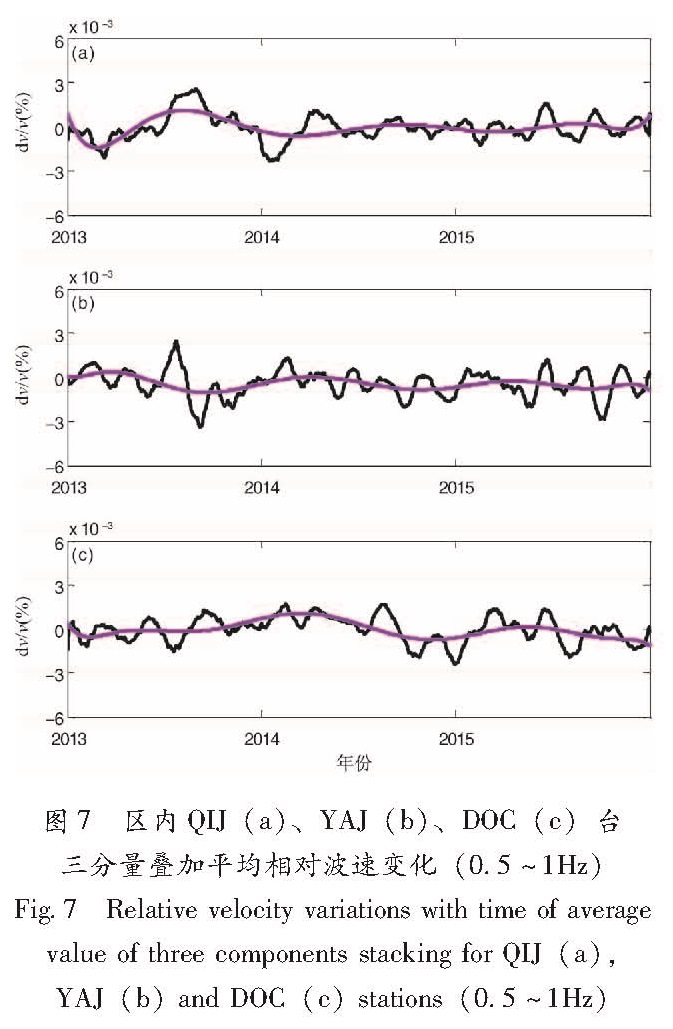
多位学者研究表明地壳介质相对波速变化存在不同时间尺度的周期性变化(Sens-Schönfelder,Wegler,2006; Ugalde et al,2014; Hillers et al,2015; 王俊等,2016)。通过对测量获得的相对波速变化(图6a黑实线)进行多阶线性拟合,得到图6a品红色实线所示相对波速变化图像(频带范围:0.2~0.5 Hz),区内各台站均呈现出夏季为波谷、冬季为波峰的以年为周期的变化特征。图6b红实线为各台站相对波速变化去除年度趋势变化后的结果,其呈现出更为明显的同震波速变化。我们进一步计算了0.5~1 Hz频带范围内的相对波速变化,并对测量结果进行了多阶线性拟合,其变化亦呈现出一定的周期性变化特征(图7)。
3 讨论
相关研究指出当激发和接收处于同一位置时,利用其自相关格林函数测量的相对波速变化能反映出半径为vt/2,深度为0.4λ区域内介质的变化,这里v为面波速度,t为波的走时,λ表示波长(Lowrie,2007)。假定地震面波速度为2 km/s,对于0.2~0.5 Hz频带范围,在走时10~25 s内所测量的波速变化反映最大地壳介质半径25 km,介质深度4 km(Ugalde et al,2014); 0.5~1 Hz频带范围,其走时4~10 s反映最大地壳介质半径10 km,深度1.6 km。
0.2~0.5 Hz频带范围上所获得的相对波速变化结果呈现出显著同震波速变化特征(图5,6b),类似这种在地震前后观测到的波速变化现象,在以往不少地震学家通过天然重复地震、人工震源及背景噪声等资料观测的研究中也多有报道。引起这种变化的物理机制,一般认为主要为以下几种:强地面运动引起的地表破坏、地震中断层的破坏与震后愈合、地震引起断层区及周边地壳介质的应力变化、地下水位变化等(Poupinet et al,
1984; Sens-Schönfelder,Wegler,2006; Ugalde et al,2014; Hillers et al,2015)。鲁甸MS6.5地震野外科学考察没有发现明显的地震地表破裂现象(徐锡伟等,2014),李西等(2014)在震后开展了详细的野外调查工作,仅在震中区NW向发震断层包谷垴—小河断裂及与其相交汇的NE向昭通—鲁甸断裂带上发现地表裂缝和小的位错,而本文所呈现的显著同震波速变化对应介质深度约4 km,理论上地表的裂缝和小的位错对该深度的波速变化结果影响不大,说明地面的运动引起的地表破坏不是造成同震波速变化的主要原因。张广伟等(2014)、何骁慧等(2015)分别采用CAP方法反演鲁甸地震主震及较强余震的震源机制解,得到主震质心深度约5 km,破裂过程显示的较大滑移量位于2~8 km,震后余震重定位结果也显示震源深度集中在4~20 km,优势分布深度在10 km以上(张广伟等,2014; 王未来等,2014; 房立华等,2014)。这些研究所揭示的主震质心深度、余震优势分布及断裂滑移位置与本研究地震波速变化所对应的介质深度相符,但考虑到各台站波速变化结果仅是对台站周边25 km范围内的介质反映,而本文所用台站距震中较近的ZAT台约为43 km、
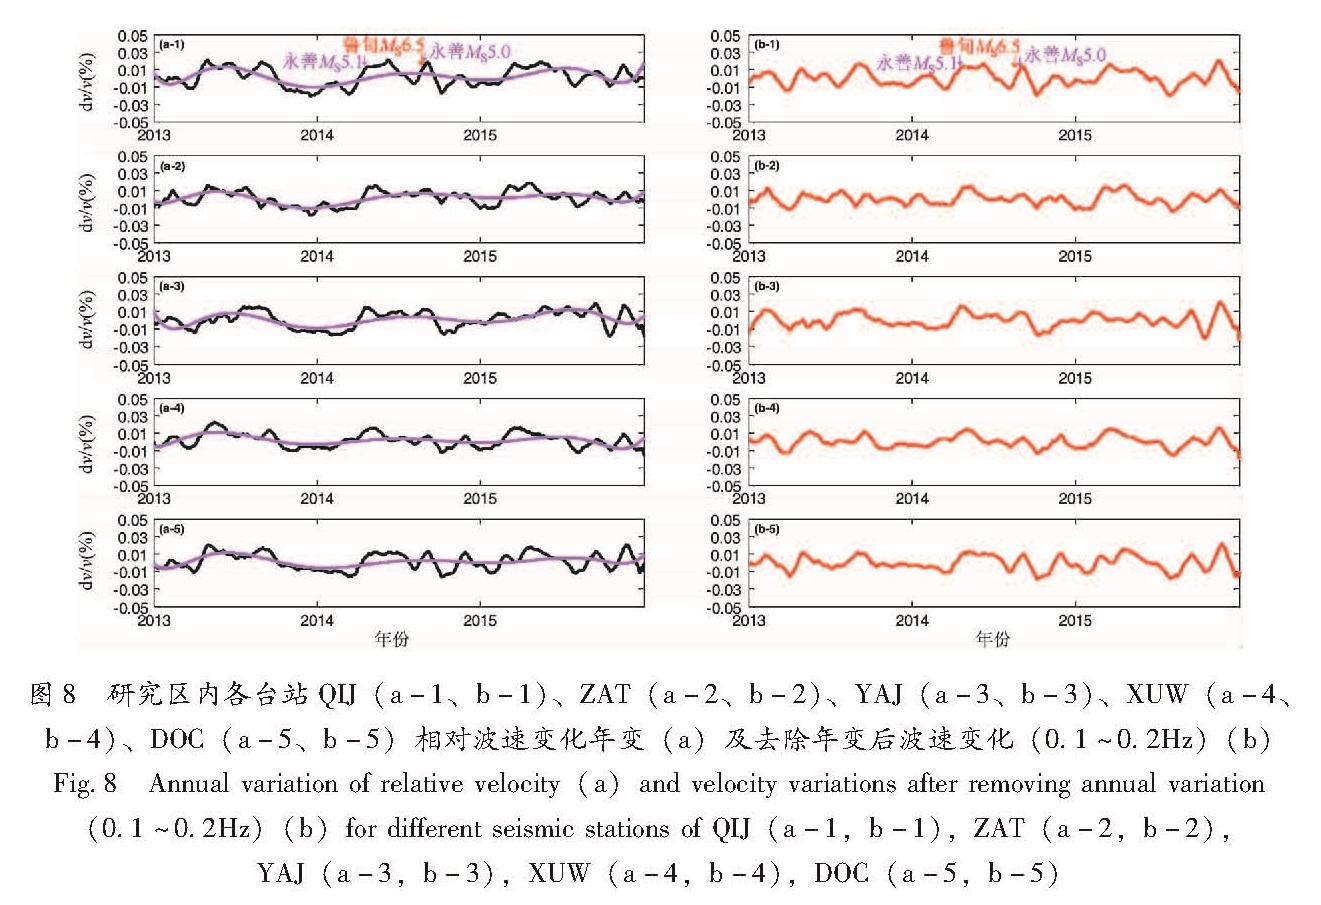
图8 研究区内各台站QIJ(a-1、b-1)、ZAT(a-2、b-2)、YAJ(a-3、b-3)、XUW(a-4、b-4)、DOC(a-5、b-5)相对波速变化年变(a)及去除年变后波速变化(0.1~0.2Hz)(b)
Fig.8 Annual variation of relative velocity(a)and velocity variations after removing annual variation(0.1~0.2Hz)(b)for different seismic stations of QIJ(a-1,b-1),ZAT(a-2,b-2),YAJ(a-3,b-3),XUW(a-4,b-4),DOC(a-5,b-5)QIJ台约为46 km(图1)。为了获得反映更大范围内介质波速变化结果,依照相同的处理方法,我们进一步计算了0.1~0.2 Hz频带范围的波速相对变化(图8),反映介质范围约50 km,深度约8 km。其计算结果呈现出类似的以年为周期的变化趋势(图8a),去除年度趋势变化亦呈现出较为明显的同震波速变化特征(图8b)。尽管0.1~0.2 Hz频带上所计算结果(ZAT、QIJ)从理论上讲是包含震中区在内的介质波速变化的反映,但自相关格林函数尾波的敏感区域主要为台站附近,是对所反映区域内介质性质变化的平均,不能认为是对震中区介质结构性质变化的一个精确反映。因此本文所用自相关格林函数尾波计算得到的震后波速降低及后期的恢复是否与地震中断层的破坏和愈合过程相关,还需要采用其他技术方法或观测手段进行深入研究和关注。
综合分析图5、6、8所示结果,一方面可以看到不同方位台站观测的波速相对变化呈现出相似变化特征(均为波速下降),未表现出类似同震体应力、应变按象限分布的现象(Cheng et al,2010; 刘志坤,黄金莉,2010; 赵盼盼等,2012)。Takagi 等(2012)利于背景噪声方法,计算2008年日本Iwate-Miyagi Nairiku MS7.2地震同震波速相对变化结果呈现出波速降低在极震区及周边广泛分布,亦未表现出膨胀区域波速降低、压缩区域波速增加的特征分布现象,Takagi等(2012)认为这是由于地表浅层介质的强地面运动掩盖了地震静态应变变化造成的相对波速变化的影响。对于区域内不同台站表现出相似的波速变化现象,我们将会从区域构造应力场变化的角度进行分析说明; 另一方面相对波速变化的大小并未因震中距的减小而增加,如QIJ(46 km)较YAJ(141 km)距离震中近,但相对波速变化反而较小,这可能是因为同震波速相对变化不仅仅与震中距的远近相关,同时可能受地壳介质结构性质、应力变化及造成的介质孔隙度及介质内流体的迁移、地下水位变化等因素影响。由于巧家地处则木河断裂带、小江断裂带及昭通断裂带的交会处(图1),地质结构复杂、地表破碎,不利于应力积累,地震发生时所释放的应力较盐津等区域少,波速变化相对小。
本文研究区域处于青藏高原东南部川滇菱形块体与华南地块之间的Ⅰ级块体边界构造带上(徐锡伟等,2014),对于计算结果中呈现的“扰动-地震-降低-恢复抬升-地震-降低-恢复-扰动”相对波速随时间变化特征,我们可以从地震引起断层区及周边地壳介质应力变化这一物理机制进行分析解释。图5显示,2013年度该区相对波速处于扰动状态,可能表明该时段研究区地壳块体处于青藏高原与华南地块相互作用的均衡期。2014年4月5日永善5.1级地震前,各台站相对波速变化图像上出现了一个为期5个月的相对平稳期(2013年11月—2014年3月),永善5.1级地震的发生打破了这种状态,地震后波速迅速减低,应力得到一定释放,这种释放持续了一个半月后,相对波速进入了快速升高期,这种快速的抬升认为应是地震后地壳应力的恢复,直至8月3日鲁甸MS6.5地震发生。鲁甸地震及8月17日永善5.0地震的发生再次造成了波速的下降,该次下降较前次更为急剧,前期所积累的应力进一步得到释放。去除年变趋势后的波速变化(图6b)显示ZAT台降低0.04%,缪淼和朱守彪(2016)计算了鲁甸地震在周边断层上产生的库伦应力变化,临近ZAT台的昭通—鲁甸断裂(东支)的应力变化值约为-0.072~0.012 MPa。据此,我们估算应力敏感系数约为(0.5~3.0)×10-8/Pa,该值与Chen等(2010)对汶川地震震区测量的应力敏感系数相近。应力释放后,波速得到了快速的恢复。研究区地壳内部应力经过一系列的释放调整,块体内部应力达到平衡,相对波速变化恢复到扰动状态。上述这一应力积累-释放的过程可推测为是青藏高原东南缘与华南地块相互作用而造成地壳内部构造应力变化的结果,块体自身的应力调整引起了鲁甸地震的发生,反过来地震的发生引起了周边地壳介质应力的变化。由于本文所使用台站较少,其结果更多显示的是震源区周边的波速变化特征,对于整个区域构造应力场的反映并不完整,因此上述解释也仅仅是就本文所计算结果的一种相对合理的分析认识。
对于0.5~1 Hz频带范围自相关格林函数测量的相对波速走时变化,反映地壳介质半径10 km、深度1.6 km,则未观测到明显的地震同震波速变化特征。通过多阶线性拟合,其变化呈现出一定的季节性变化特征,这种季节性的变化则可能与多种影响因素相关,如气温、气压、降雨、地下水位或季节性地下流体等(Sens-Schönfelder,Wegler,2006; Ugalde et al,2014; Hillers et al,2015)。
4 结论
本文利用云南区域数字地震台网QIJ等5个台站所记录到的三分量背景噪声数据,在0.1~0.2 Hz、0.2~0.5 Hz、0.5~1 Hz频率范围内计算背景噪声自相关格林函数,选取相应尾波段数据分别运用移动窗互谱技术、伸缩技术计算了鲁甸地震震区及周边地壳2013年1月至2015年12月期间地壳相对波速随时间的变化。研究结果表明:两种测量方法计算结果趋势较为一致,但在使用伸缩技术测量时会引起一定的视速度(Zhan et al,2013)。0.1~0.2 Hz、0.2~0.5 Hz频带范围内测量的相对波速变化对介质的敏感深度分别为8 km、4 km。其中,0.2~0.5 Hz频带内计算结果表现出较强的年变趋势,对区内发生的鲁甸地震及永善地震呈现出明显的同震波速变化,去除年变趋势后,同震波速变化表现更为显著,距离鲁甸地震震中最近的ZAT台及靠近2次永善地震震中的YAJ台波速下降最大,下降达0.06%。研究时段内整个区域相对波速变化呈现出“扰动-地震-降低-恢复抬升-地震-降低-恢复-扰动”的特征,推测其可能是青藏高原东南缘与华南地块相互作用而造成研究区地壳构造应力变化的反映。0.5~1 Hz频带范围测量结果,反映地壳介质深度约1.6 km,未观测到明显的同震波速变化,但其呈现出一定的季节性变化特征,这种季节性的变化可能与气温、气压、降雨、地下水位变化等多种影响因素相关。
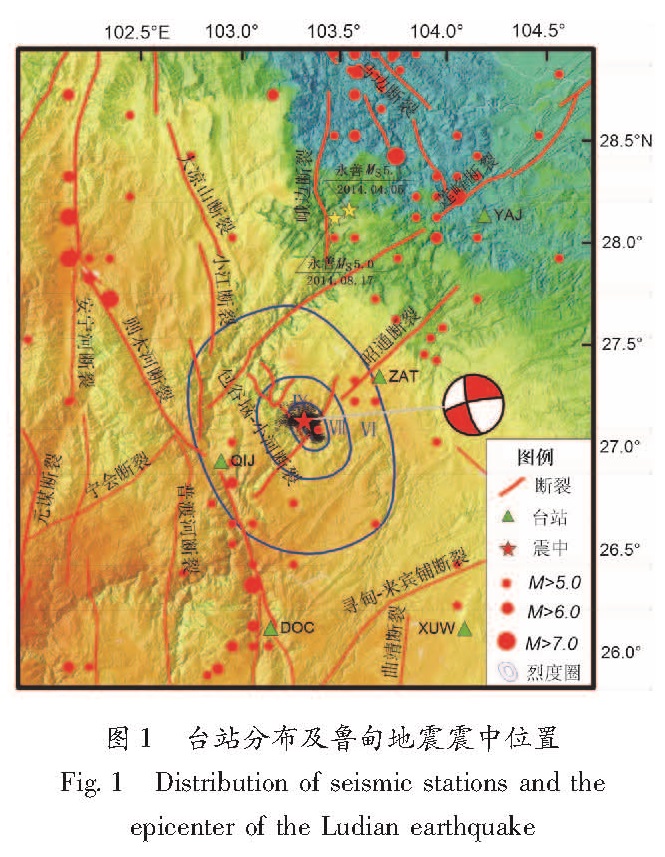
1.1 台站与观测数据选取本文选用位于鲁甸震区及周边区域内的QIJ(巧家,震中距:46 km)、ZAT(昭通,43 km)、DOC(东川,143 km)、XUW(宣威,140 km)、YAJ(盐津,141 km)5个云南区域数字地震台站记录的三分量连续波形数据进行计算研究,分布位置如图1所示,所用数据时间范围为2013年1月至2015年12月。所选用台站均为EDAS2-24 IP 数据采集器、60 s-50 Hz宽频带地震计、24位字长、100 Hz采样率,动态范围可达140 dB。
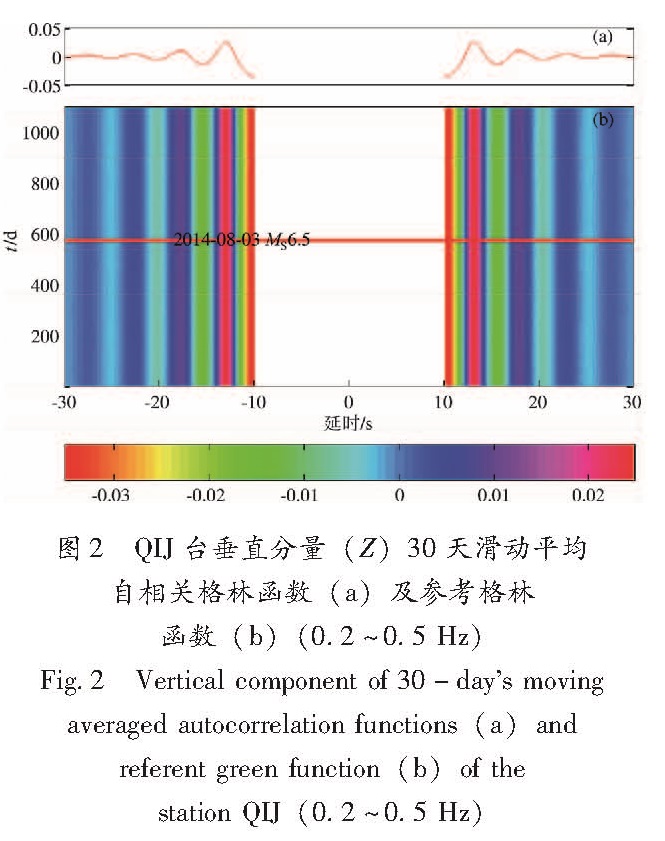
1.2 研究方法1.2.1 自相关格林函数的计算分别计算每个台站三分量自相关格林函数。首先进行数据预处理,将单台单分量数据分割、拼合为1 d共24 h长度数据段(单天数据长度小于12 h的数据段舍弃),然后进行20 Hz重采样、去均值、去趋势、去仪器响应,分别在0.2~0.5 Hz、0.5~1 Hz频带域范围内进行滤波和谱白化,接着在时域内进行one-bit归一化处理,这样去除天然地震和仪器本身异常信号的影响(Bensen et al,2010)。最后将各个台站每天的三分量数据分别进行自相关运算,得到单天3个分量(ZZ、EE、NN)的自相关函数数据段,而自相关格林函数是其自相关函数的近似,求导过程仅会引起相位的偏移,而不影响相对波速的测量(Sabra et al,2005)。在进行相对波速变化测量之前,还需要获得“当前格林函数”和“参考格林函数”。为提高当前格林函数的信噪比,通常采用沿时间轴滑动叠加一定窗长内的单天自相关函数来获取,本文采用以30 d为窗长、1 d为步长的滑动窗进行滑动叠加获得当前格林函数。具体来说,就是通过对当天及其之前29 d(共30 d)的自相关函数叠加来代表当前格林函数,如果可用来叠加的天数少于20,则舍弃。而对于2013年1月1日当前格林函数的获取则为2012年12月3日至2013年1月1日共30天的自相关函数的叠加,这样避免了2013年1月前29 d因叠加天数的不足而造成当前格林函数信噪比不够的情况发生。对于参考格林函数的确定,为了最大限度减少背景噪声源季节性变化的影响,一般用较长时间尺度(至少1 a)的相关函数叠加获得。本文将整个观测时段长度内的自相关函数进行叠加取平均值获得各台站各分量参考格林函数。图2a给出了QIJ台垂直分量经归一化后的参考格林函数。图2b给出了QIJ台垂直分量30 d滑动平均归一化后的自相关格林函数,为了突出其尾波信号,图中我们将延时在-10~10 s的信号段省去。图2b中红色直线指示鲁甸地震发生时间。从图中可以看到稳定的尾波信号,各相位具有很好的连续性,这说明从地震背景噪声中提取的自相关格林函数是稳定可靠的。
1.2.2 相对波速变化测量假定地壳介质的地震波速相对变化是空间均匀的,地震波速度的相对变化Δv/v可以通过测量当前格林函数与参考格林函数的相对走时偏移Δτ/τ来计算,其存在 Δv/v=-Δτ/τ的关系,测量一般采用移动窗互谱技术(Poupinent et al,1984; Clarke et al,2011)或伸缩技术(Lobkis,Weaver,2000)。理论和实验室研究表明这2种方法对于速度扰动具有相当的灵敏度,但伸缩法具有更高的稳定性(Hadziioannou et al,2009)。然而,有研究指出利用伸缩技术在不同时间尺度上利用背景噪声测量波速变化会产生一定的视速度(Zhan et al,2013)。本研究中,我们将分别利用这2种方法对鲁甸震区及其周边地壳相对波速变化进行测量。
(1)尾波段的选取:已有研究表明背景噪声格林函数中,除包含直达波、面波外,还包含有散射波场的信息,即尾波(Sens-Schönfelder,Wegler,2006)。尾波中包含的散射路径信息是对台站间或周围介质较为全面的采样,对介质性质的变化更为敏感,可以用来监测介质的微弱变化(Roux,2005)。在用尾波段进行相对波速变化测量时至少需要在3个波长内进行计算才能获得较可靠的结果,本文尾波段信号长度选取测量频带范围最大周期的3倍,起点位置为最大周期的2倍处,对于0.2~0.5 Hz频带的测量尾波段为10~25 s,对0.5~1 Hz选取尾波段为4~10 s(Ugalde et al,2014)。
(2)移动窗互谱技术:该方法是在上述所选尾波段信号段上,再以各频带范围最大周期为窗长的10%为步长的滑动小窗内(对应0.2~0.5 Hz频带范围,其窗长5 s,步长0.5 s; 0.5~1 Hz频带,窗长2 s,步长0.2 s)计算当前格林函数与参考格林函数的互相关谱,测量其在不同频率f的相位偏移Δf,对二者进行加权线性拟合得到当前格林函数与参考格林函数在每个小窗上时间τ的走时偏移:Δτ=Δf/(2π×f)。由于测量得到的每个小窗走时偏移Δτ与小窗的中心到时τ呈线性关系,进而再一次通过加权线性拟合求取其斜率,即为其走时偏移Δτ/τ,取其相反数便得到速度相对变化:v/v=-Δτ/τ。该方法的计算细节可参考Clarke 等(2011)的研究。
(3)伸缩技术:将相对延时当作一个伸缩因子ε,通过该因子将一条记录沿时间轴进行拉伸或压缩,求其与另一条记录之间的最大相关(Lobkis,Weaver,2003; Sens-Schönfelder,Wegler,2006)。具体计算是在上述选取的尾波段信号时间轴上,对当前格林函数进行重采样t(1-ε),通过网格搜索的方式,不断尝试ε的值,计算其与参考格林函数的相关系数cc(ε),当相关系数取得最大值cc(εmax)时,εmax即为真实的相对波速变化:v/v=-Δτ/τ=εmax。
- 陈颙,王宝善,葛洪魁,等.2007.建立地震发射台的建议[J].地球科学进展,22(5):441-446.
- 程佳,徐锡伟,刘杰.2016.2014年鲁甸6.5级地震成因、破裂特征和余震分布特征的库仑应力作用[J].地球物理学报,59(2):556-567.
- 房立华,吴建平,王未来,等.2014.云南鲁甸MS6.5地震余震重定位及其发震构造[J].地震地质,36(4):1173-1185.
- 付芮,单斌,熊熊,等.2015.2014年云南鲁甸地震同震库仑应力对余震分布及周边断层的影响[J].地震地质,37(4):1084-1095.
- 何骁慧,倪四道,刘杰.2015.2014年8月3 日云南鲁甸M6.5 地震破裂方向性研究[J].中国科学:地球科学,45(3):253-263.
- 金明培,杨军,陈佳,等.2014.2014年8月8日云南鲁甸M6.5级地震概况[J].地球物理学进展,29(4):1980-1984.
- 李西,张建国,谢英情,等.2014.鲁甸MS6.5地震地表破坏及其与构造的关系[J].地震地质,36(4):1280-1291.
- 刘志坤,黄金莉.2010.利用背景噪声互相关研究汶川地震震源区地震波速度变化[J].地球物理学报,53(4):853-863.
- 缪淼,朱守彪.2016.2014 年鲁甸地震(MS=6.5)静态库仑应力变化及其影响[J].地震地质,38(1):169-181.
- 王俊,郑定昌,郑江蓉,等.2016.利用背景噪声自相关研究芦山M7.0地震震源区地壳相对波速的时空变化特征[J].地震地质,38(1):152-168.
- 王未来,吴建平,房立华,等.2014.2014年云南鲁甸MS6.5地震序列的双差定位[J].地球物理学报,57(9):3042-3051.
- 徐锡伟,江国焰,于贵华,等.2014.鲁甸6.5级地震发震断层判定及其构造属性讨论[J].地球物理学报,57(9):3060-3068.
- 张广伟,雷建设,梁姗姗,等.2014.2014年8月3日云南鲁甸MS6.5地震序列重定位与震源机制研究[J].地球物理学报,57(9):3018-3027.
- 张勇,陈运泰,许力生,等.2015.2014年云南鲁甸MW6.1地震:一次共轭破裂地震[J].地球物理学报,58(1):153-162.
- 张勇,许力生,陈运泰,等.2014.2014年8月3日云南鲁甸MW6.1(MS6.5)地震破裂过程[J].地球物理学报,57(9):3052-3059.
- 赵盼盼,陈九辉,刘启元,等.2012.汶川地震区地壳速度相对变化的环境噪声自相关研究[J].地球物理学报,55(1):137-145.
- AGGARWAL Y P,SYKES L R,ARMBRUSTER J,et al. 1973. Premonitory Changes in Seismic Velocities and Prediction of Earthquakes[J].Nature,241(5385):101-104.
- ANGGONO T T,NISHIMURA H,SATO H,et al.2012.Spatio-temporal changes in seismic velocity associated with the 2000 activity of Miyakejima volcano as inferred from cross-correlation analyses of ambient noise[J].J Volcanol Geoth Res,247-248,93-107.
- BENSEN G D,RITZWOLLER M H,BARMIN M P,et al. 2010. Processing seismic ambient noise data to obtain reliable broad-band surface wave dispersion measurements[J].Geophysical Journal of the Royal Astronomical Society,169(3):1239-1260.
- BRENGUIER F,CAMPILLO M,HADZIIOANNOU C,et al. 2008a. Postseismic Relaxation Along the San Andreas Fault at Parkfield from Continuous Seismological Observations[J].Science,321:1478-1481.
- BRENGUIER F,SHAPIRO N M,CAMPILLO M,et al.2008b.Towards forecasting volcanic eruptions using seismic noise[J].Translated World Seismology,1(2):126-130.
- CHEN J H,FROMENT B,LIU Q Y,et al.2010.Distribution of seismic wave speed changes associated with the 12 May 2008 MW7.9 Wenchuanearthquake[J].Geophys Res Let,37(18):109-118.
- CHENG X,NIU F,WANG B.2010.Coseismic Velocity Change in the Rupture Zone of the 2008 MW7.9 Wenchuan Earthquake Observed from Ambient Seismic Noise[J].Bull Seismol Soc Am,100(5B):2539-2550.
- CLARKE D,ZACCARELLI L,SHAPIRO N M,et al.2011.Assessment of resolution and accuracy of the MovingWindow Cross Spectral technique for monitoring crustal temporal variations using ambient seismic noise[J].Geophys J Int,186(2):867-882.
- CRAMPIN S,BOOTH D C,EVANS R,et al.1990.Changes in shear wave splitting at Anza near the time of the North Palm Springs Earthquake[J].J Geophys Res,95(B7):11197-11212.
- DUPUTEL Z,FERRAZZINI V,BRENGUIER F,et al.2009.Real time monitoring of relative velocity changes using ambient seismic noise at the Piton de la Fournaise volcano(La Réunion)from January 2006 to June 2007[J].J Volcanol Geoth Res,184:164-173.
- FURUMOTO M,ICHIMORI Y,HAYASHI N,et al.2001.Seismic wave velocity changes and stress build-up in the crust of the Kanto-Tokai region[J].Geophysical Research Letter,28(19):3737-3740.
- HADZIIOANNOU C,LAROSE E,COUTANT O,et al.2009.Stability of monitoring weak changes in multiply scattering media with ambient noise correlation:Laboratory experiments[J].J Acoust Soc Am,125(6):3688-3695.
- HILLERS G,BEN-ZION Y,CAMPILLO M,et al.2015.Seasonal variations of seismic velocities in the San Jacinto fault area observed with ambient seismic noise[J].Geophys J Int,202(2):920-932.
- JIN A,AKI K.1986.Temporal change in coda Q before the Tangshan Earthquake of 1976 and the Haicheng Earthquake of 1975[J].J Geophys Res,91(B1):665-673.
- KONDRATENKO A M,NERSESOV I L.1962.Some results of the study on changes in the velocity of longitudinal and transverse waves in a focal zone(in Russian)[J].Tr Inst Fiz Zemli,25:130-150.
- LIU Z,HUANG J,PENG Z,et al.2014.Seismic velocity changes in the epicentral region of the 2008 Wenchuan earthquake measured from three-component ambient noise correlation techniques[J].Geophysical Research Letters,41(1):37-42.
- LOBKIS O I,WEAVER R L.2003.Coda-wave interferometry in finite solids:recovery of P-to-S conversion rates in an elastodynamic billiard[J].Physical Review Letters,90(1):254302.
- LOWRIE W.2007.Fundamentals of Geophysics Second Ed[M].New York:Cambridge University Press,375.
- MOONEY W D,GINZBURG A.1986.Seismic measurements of the internal properties of fault zones[J].Pure Appl Geophys,124(1-2):141-157.
- MORDRET A,JOLLY A D,DUPUTEL Z,et al.2010.Monitoring of phreatic eruptions using interferometry on retrieved cross-correlation function from ambient seismic noise:Results from Mt.Ruapehu,New Zealand,J.Volcanol[J].Geoth Res,191:46-59.
- POUPINENT G,ELLSWORTH W L,FRECHET J.1984.Monitoring velocity variations in the crust using earthquake doublets:An application to the Calaveras Fault,California[J].J Geophys Res,89:5719-5731.
- ROUX P.2005.P-waves from cross-correlation of seismic noise[J].Geophys Res Lett,32(19):L19303.
- ROUX P.2009.Passive seismic imaging with directive ambient noise:application to surface waves and the San Andreas Fault in Parkfield,CA[J].Geophys J Int,179(1):367-373.
- SABRA K G,GERSTOFT P,ROUX P,et al.2005.Extracting time domain Green's function estimates from ambient seismic noise[J].Geophys Res Lett,32,L03310.
- SENS C.2011.Passive image interferometry for monitoring crustal changes with ambient seismic noise[J].Comptes rendus-Géoscience,343(8),639-651.
- SENS-SCHÖNFELDER C,LAROSE E.2008.Temporal changes in the lunar soil from correlation of diffuse vibrations[J].Phys Rev E,8(4):045601.
- SENS-SCHÖNFELDER C,WEGLER U.2006.Passive image interferometry and seasonal variations of seismic velocities at Merapi Volcano,Indonesia[J].Geophys Res Lett,33(21):L21302.
- SHAPIRO N M,CAMPILLO M.2004.Emergence of broadband Rayleigh waves from correlations of the ambient seismic noise[J].Geophysical Research Letters,31:L07614,doi:10.1029/2004GL019291.
- TAKAGI R,OKADA T,NAKAHARA H,et al.2012.Coseismic velocity change in and around the focal region of the 2008 Iwate‐Miyagi Nairikuearthquake[J].Journal of Geophysical Research:Solid Earth,117(B6):6315.
- UGALDE A,GAITE B,VILLASENOR A.2014.Temporal Variations of Seismic Velocity at Paradox Valley,Colorado,Using Passive Image Interferometry[J].Bull Seismol Soc Am,104(3):1088-1099.
- WEGLER U,NAKAHARA H,SCHÖNFELDER C S,et al.2009.Sudden Drop of Seismic Velocity after the 2004 MW6.6 Mid-Niigata Earthquake,Japan,Observed with Passive Image Interferometry[J].J Geophys Res,114:B06305.
- WEGLER U,SENS-SCHÖNFELDER C.2007.Fault zone monitoring with passive image interferometry[J].Geophys J Int,168(23):1029-1033.
- ZHAN Z,TSAI V C,CLAYTON R W.2013.Spurious velocity changes caused by temporal variations in ambient noise frequency content[J].Geophys J Int,194(3):1574-1581.
