基金项目:国家自然科学基金青年科学基金项目(41804010)和国家重点研发计划课题(2018YFC1503606)联合资助.
备注
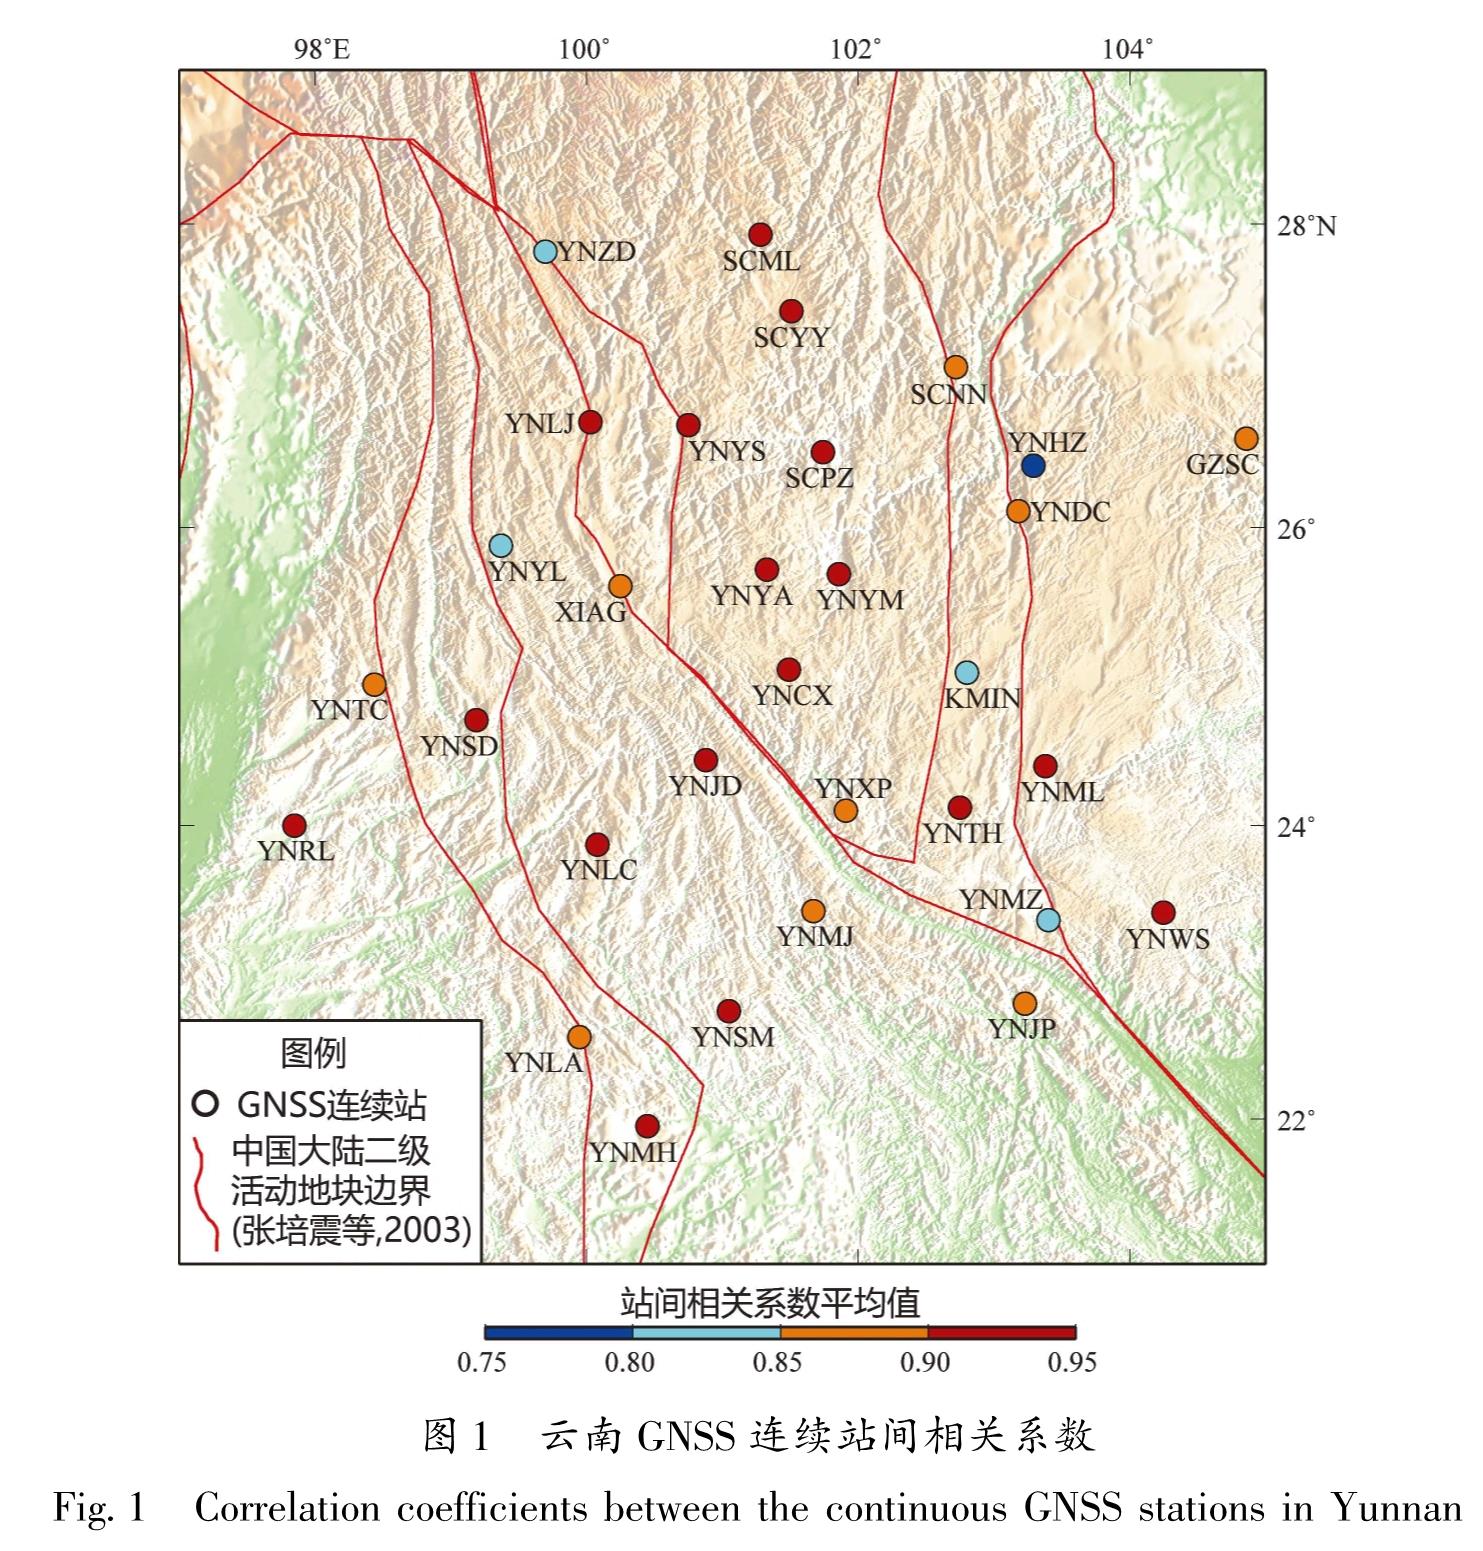
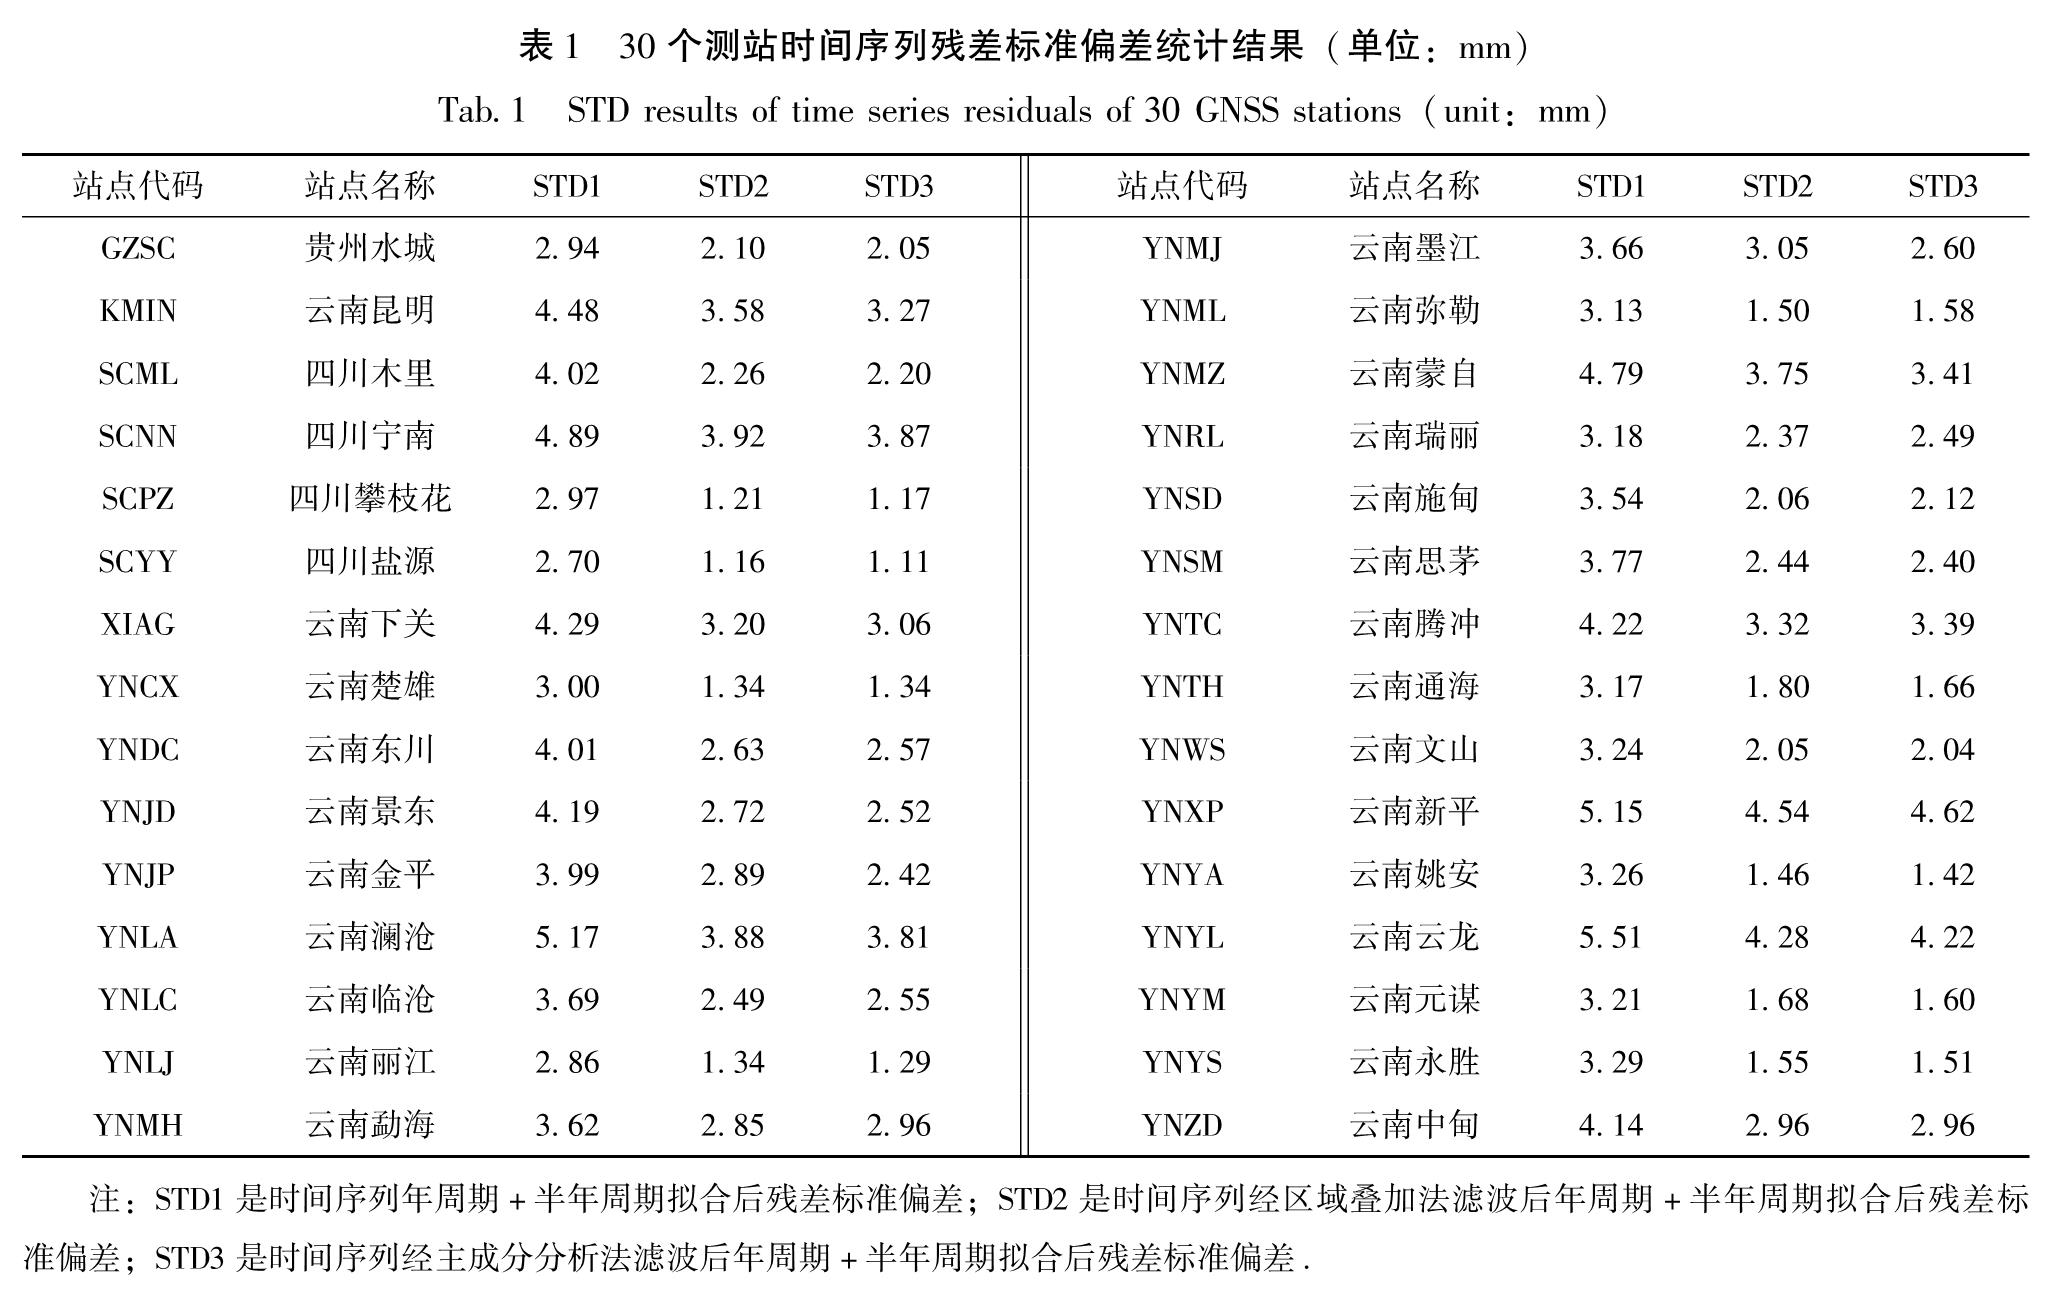
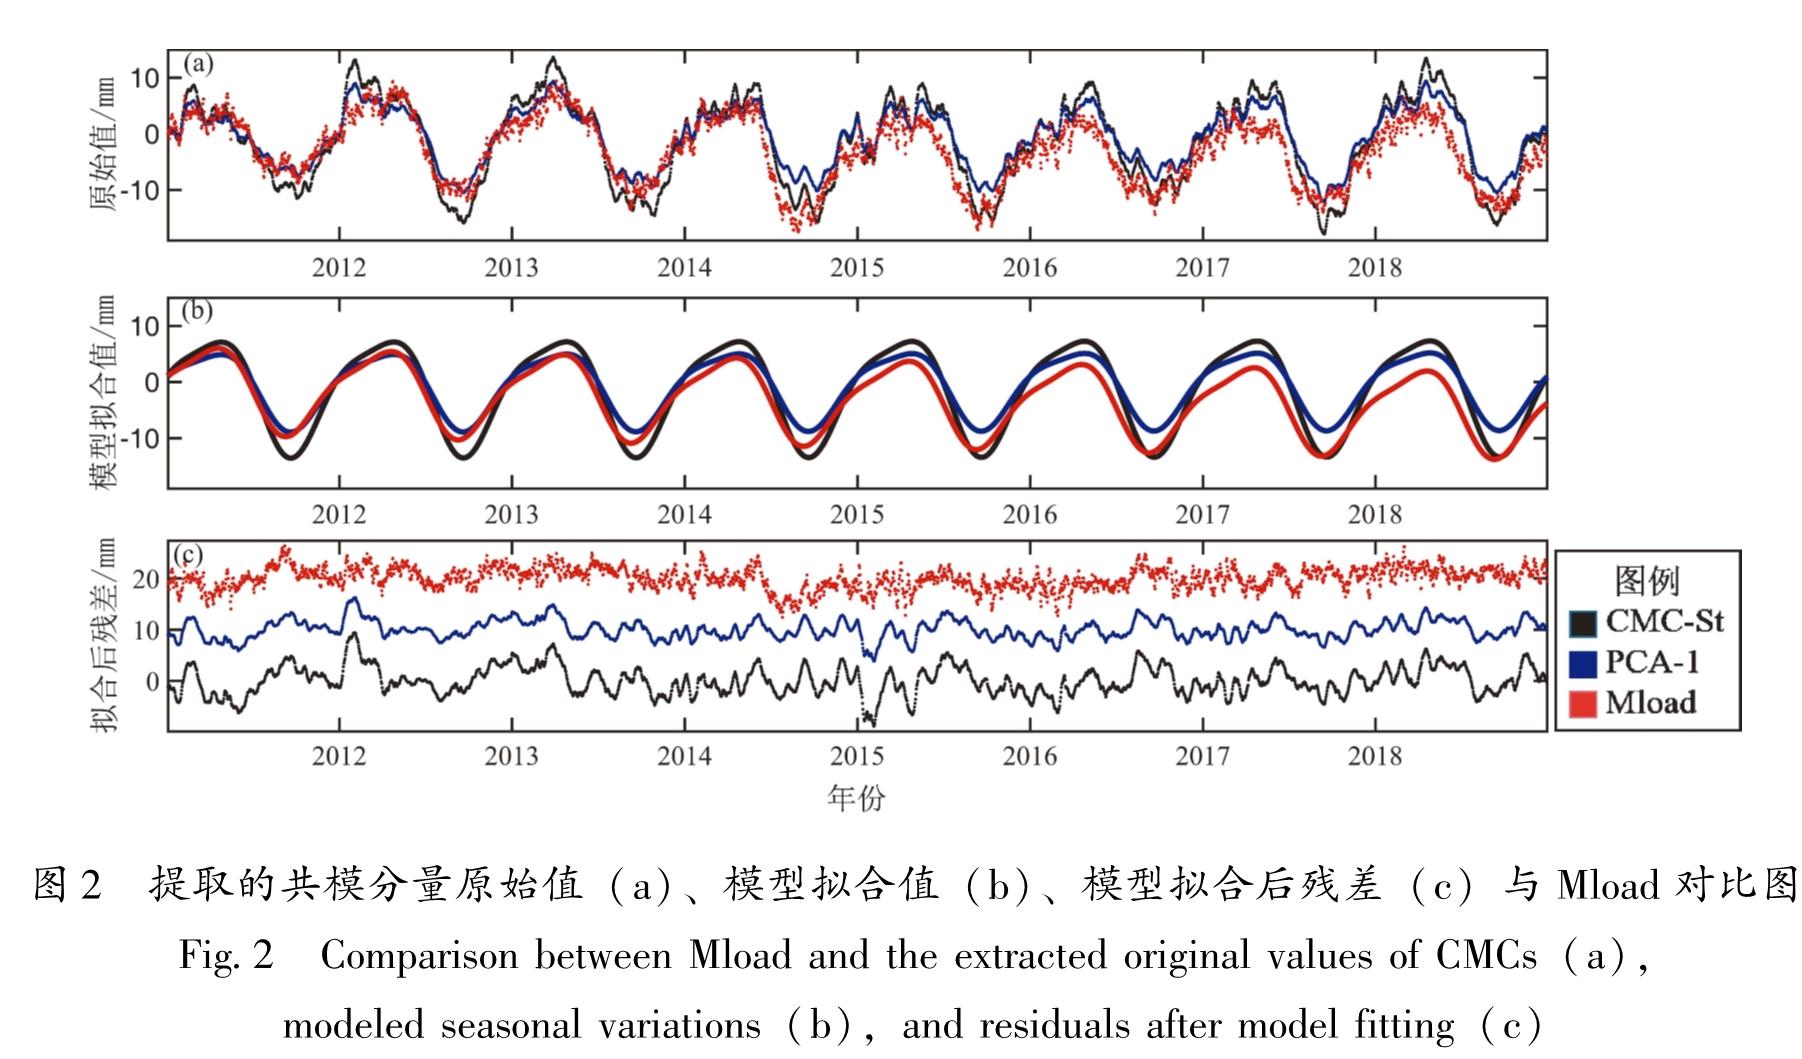
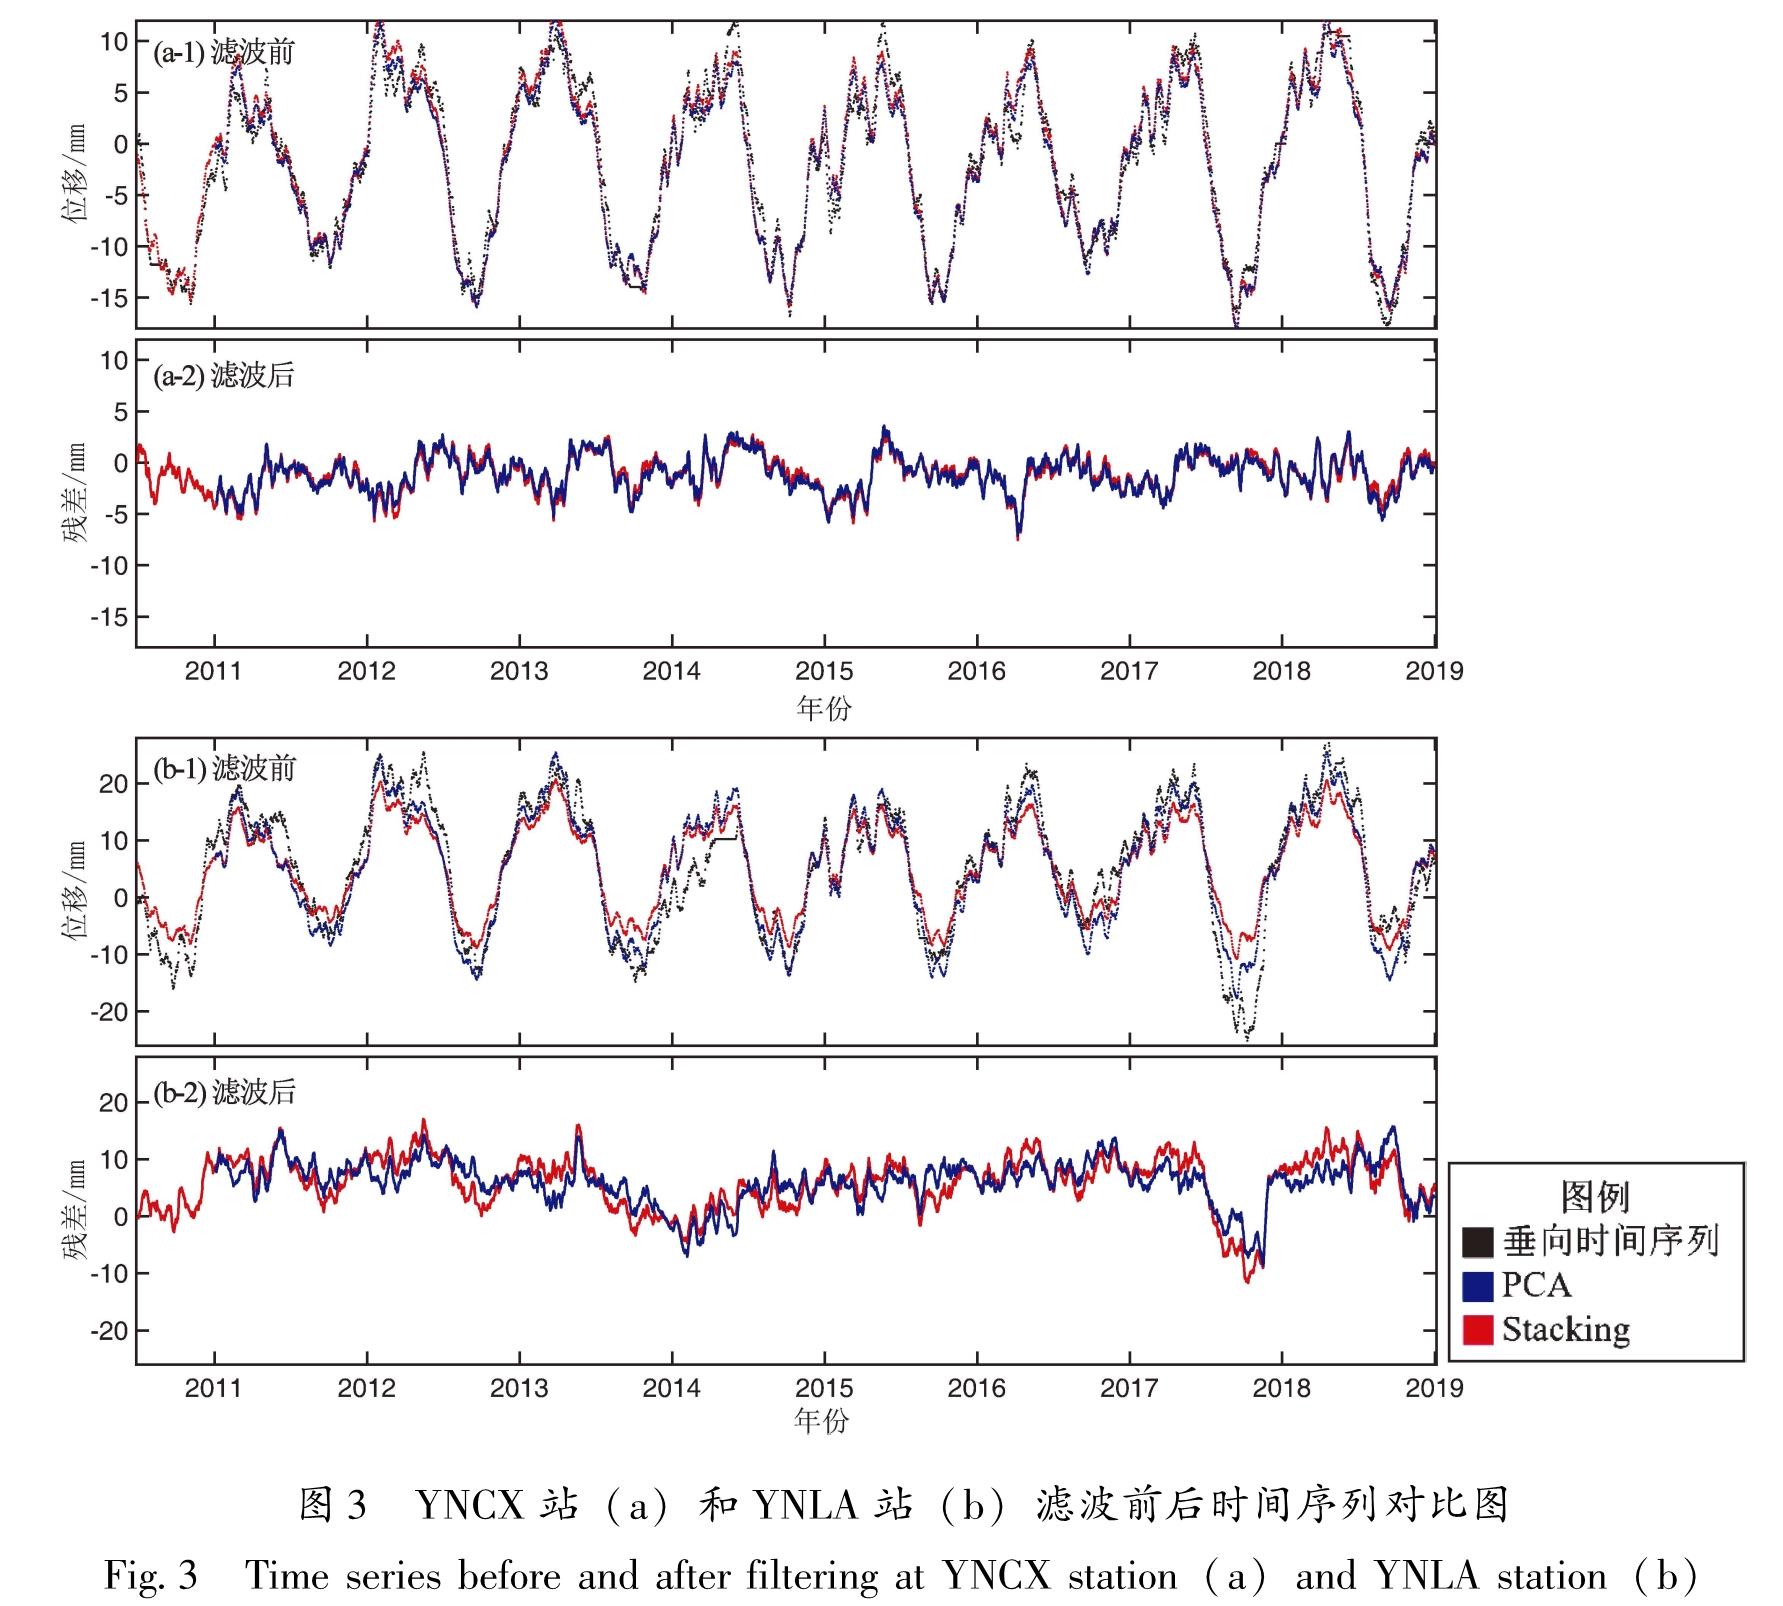
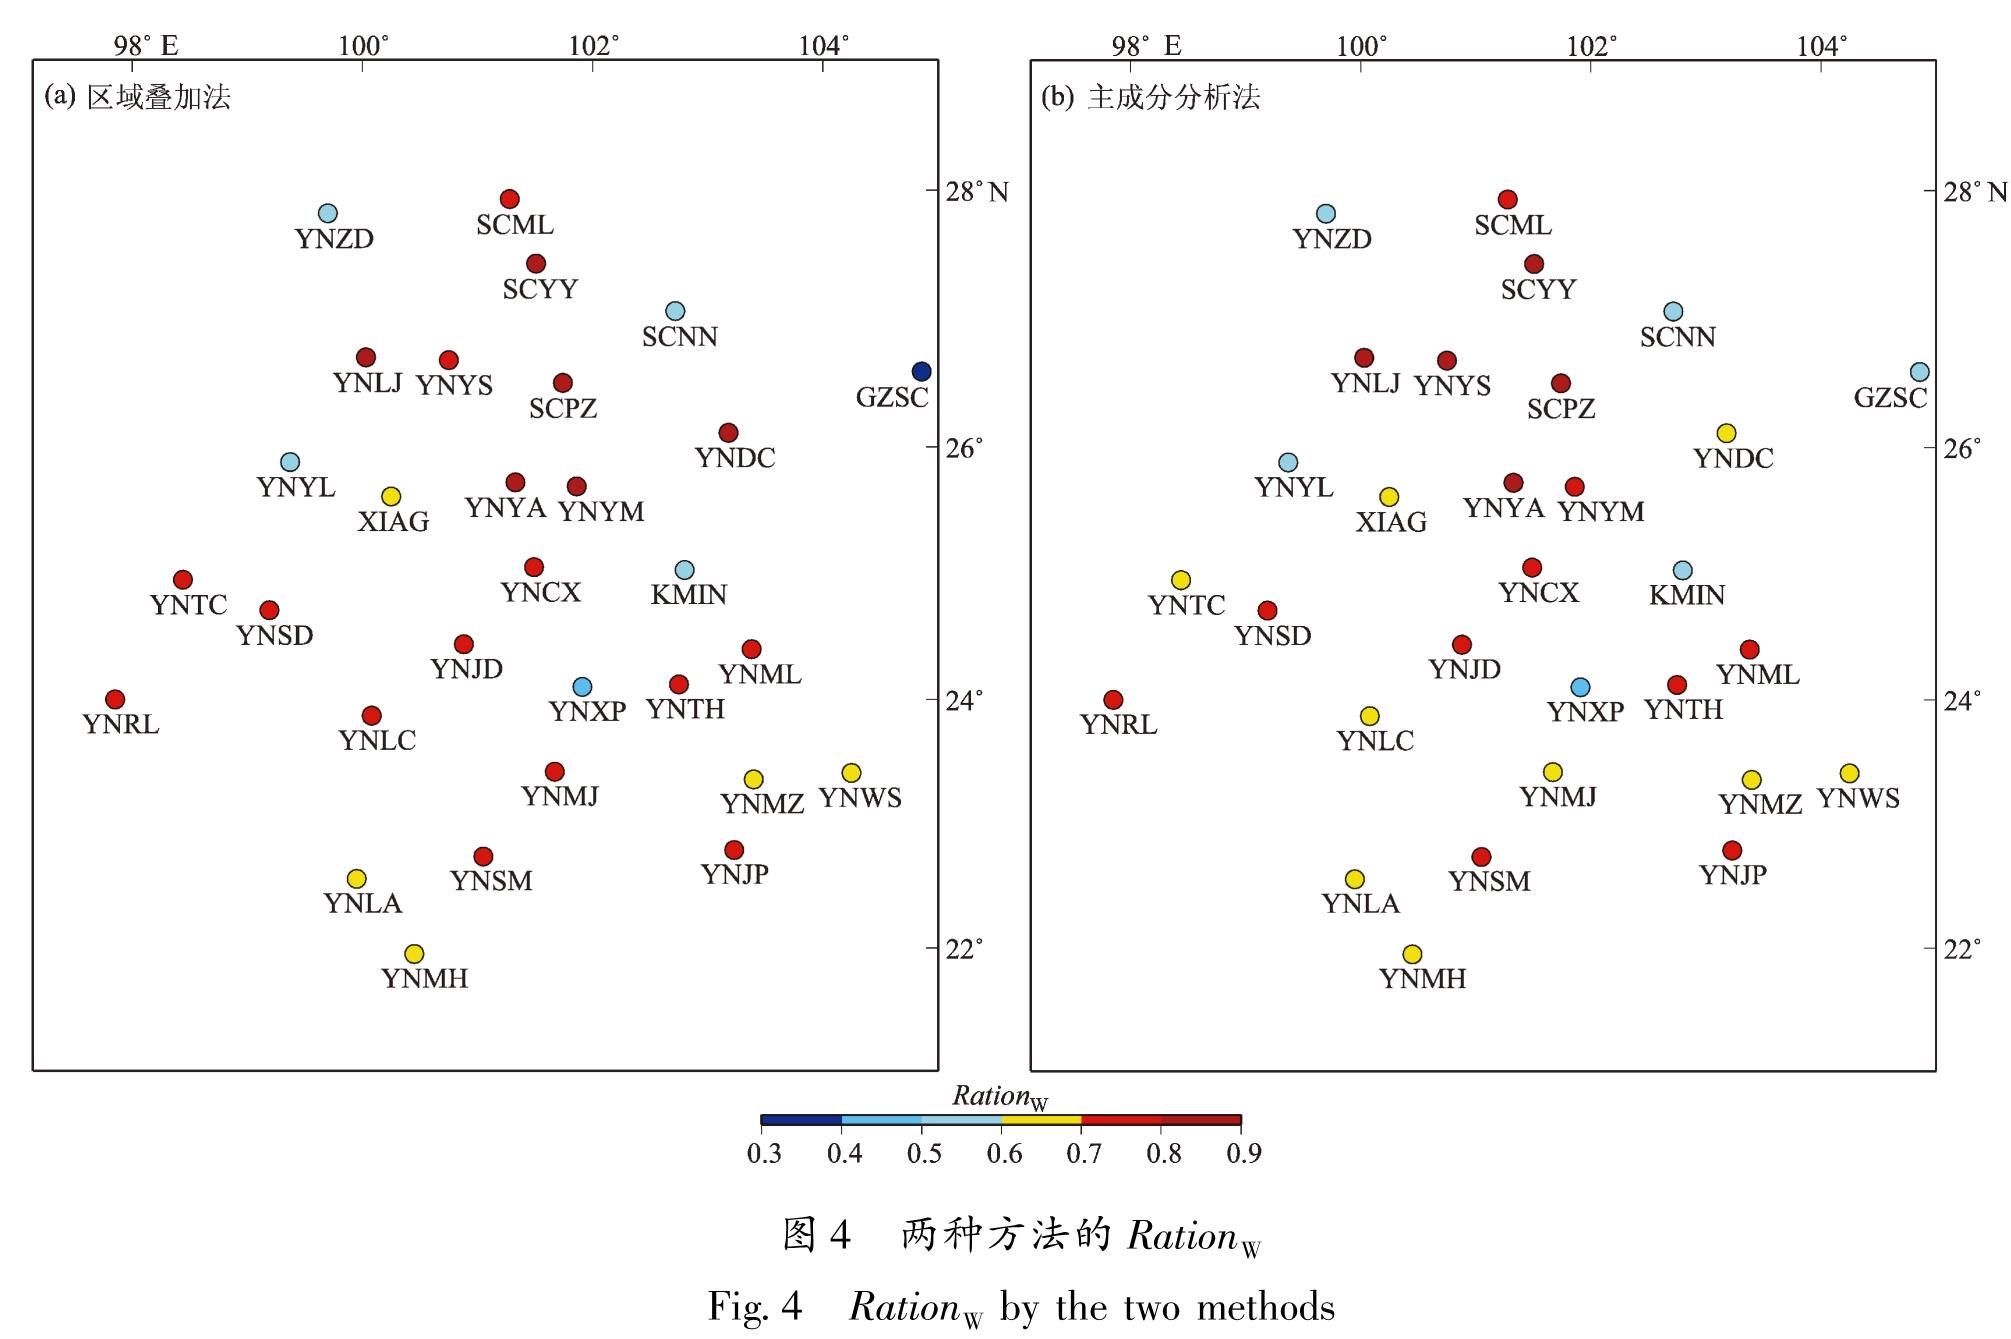
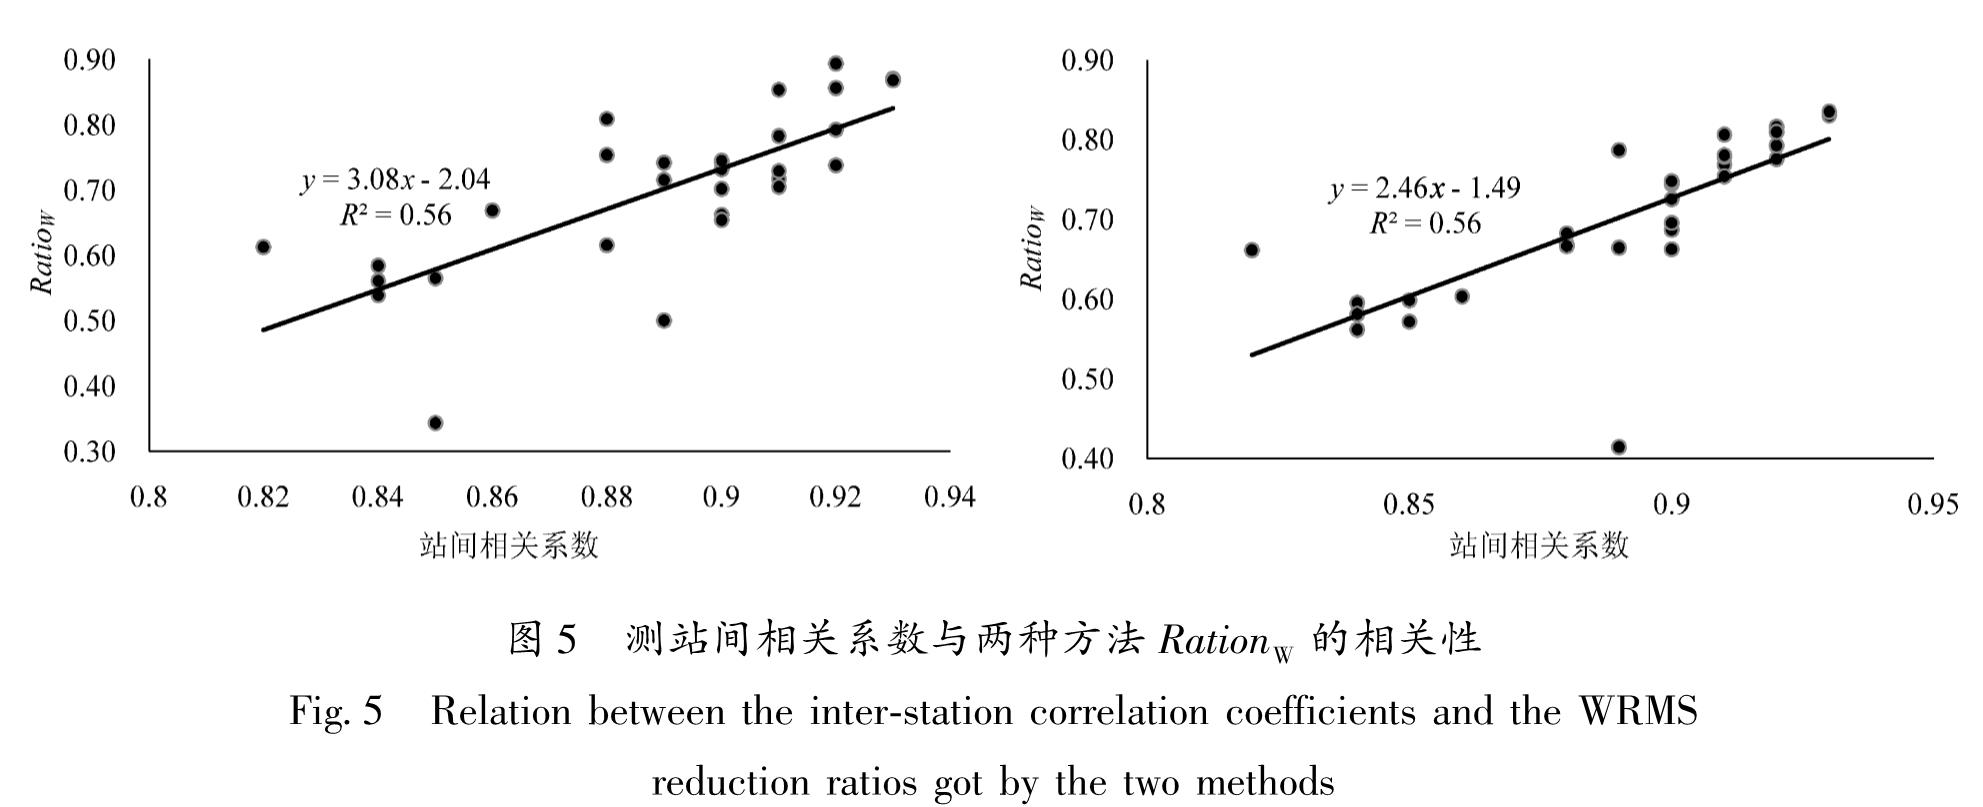
针对共模分量的精确获取问题,以2011—2018年云南31个GNSS连续站垂向时间序列为基础,选用区域叠加法和主成分分析法,提取得到共模分量的主要成分,对比分析了这两种方法的效果。结果 表明:①由于云南垂向非线性运动空间一致性较好(测站间相关系数平均值为0.88),两种方法得到的共模分量较为一致; ②两种方法提取得到的共模分量与全球水文负荷和大气负荷模型给出的位移时间序列接近(相关系数均为0.9),说明共模分量的主要成分为地表负荷变化引发的地壳垂向非构造运动; ③共模分量不能用周期模型完全表示,还包含了年际间的运动差异等信息; ④两种方法的空间滤波效果非常接近(WRMS减速比平均值都为0.70),测站的空间滤波效果与测站间相关系数呈显著的正相关。由于区域叠加法对测站数据完整率要求相对较低,因此建议当测站较少或者数据缺失较多时,采用区域叠加法; 在测站较多且数据完整率较高时,建议采用主成分分析法。
For the accurate acquisition of the common-mode component(CMC),two commonly used methods are selected,namely the stacking method and the principal component analysis(PCA)method. Then,based on the vertical time series of 31 continuous GNSS stations in the period 2011-2018 in Yunnan,the effects of the two methods are evaluated. The results show that:①Due to the good spatial consistency of the vertical nonlinear motion in Yunnan(the average correlation coefficient between stations is 0.88),the CMCs obtained by the two methods are relatively close. ②The extracted CMCs are consistent with the vertical time series given by the global hydrological mass loading model and the atmospheric mass loading model(the correlation coefficients are both 0.9),which indicates that the main components of the CMCs are the non-tectonic,vertical,crustal movement induced by the variations of surface loading.③The CMC cannot be fully represented by the periodic model,for it also contains information such as inter-annual variation. ④The spatial filtering effect of the two methods is very close to the average WRMS Reduction Ratio of 0.70. The spatial filtering effects of the stations were significantly and positively correlated with the inter-station correlation coefficients. Since the stacking method requires relatively low data-integrity rate,it is suggested to use the stacking method when there are few continuous GNSS stations or a lot of missing data. The PCA method is recommended in areas with dense continuous GNSS network and high data-integrity rate,which shows the difference in the amplitude of the movement from year to year.
