基金项目:陕西省自然科学基础研究计划(2023-JC-QN-0306,2021JQ-981); 国家重点研发计划(2018YFC1503405); 国家自然科学基金青年基金(41904063).
第一作者简介:张 佩(1989-),助理研究员,主要从事地震学成像方法与地球内部物理方面的研究.E-mail:zhpec15@163.com.
(1.中国地震局第二监测中心,陕西 西安 710054; 2.中国地震局地球物理研究所,北京 100081)
背景噪声; 西昌台阵; 安宁河—则木河断裂带; 波速变化
(1.The Second Monitoring and Application Center,China Earthquake Administration,Xi'an 710054,Shaanxi,China)(2.Institute of Geophysics,China Earthquake Administration,Beijing 100081,China)
ambient noise; the Xichang array; the Anninghe-Zemuhe fault zone; wave-velocity variation
DOI: 10.20015/j.cnki.ISSN1000-0666.2024.0045
在地壳演化过程中,介质的物理性质将发生一系列改变,如出现微破裂、扩容、塑性硬化等,因此当地震波通过地壳传播时,波速也将发生相应的变化,所以通过波速的变化研究地下介质的物性变化是可行的(冯德益,1981)。早在20世纪六七十年代,研究人员就关注到地震前波速会有微小变化,而预期会存在很大变化的结果都争议较大。地质环境中影响波速走时改变的因素很多,包括潮汐应力(De Fazio et al,1973)、地下水的季节性改变(Sens-Schönfelder,Wegler,2006)、地震或火山活动导致的应力改变(Rubinstein,Beroza,2005; Peng,Ben-Zion,2006)、震前的流体迁移和扩容(Aggarwal et al,1973)等。因此研究地震波速变化对地震监测预报和火山预警等都有重要的意义。
主动源探测技术(Vidale,Li,2003; Wang et al,2008)和重复地震的相似波形(Peng,Ben-Zion,2006; Schaff,Beroza,2004)实现了对地下时变的监测,但它们在时空上的不均匀性使得连续长期的地震波速监测依旧困难重重。近年来,得益于地震背景噪声技术的发展,使用背景噪声互相关得到的相似波形推动了连续监测地震波速变化技术的快速发展。已有很多研究利用这一技术来监测地下介质的时间变化,包括地下波速的季节性变化(Sens-Schönfelder,Wegler et al,2006; Wang et al,2017)、与火山喷发相关的波速变化以及与强震相关的波速变化等(Brenguier et al,2008a,b; Chen et al,2010; Hobiger et al,2016; Liu et al,2014; Nimiya et al,2017; Wu et al,2016; 杨建文等,2021)。
本文收集了2013—2018年安宁河—则木河断裂带周边地区23个宽频带地震仪记录的连续波形数据,利用背景噪声互相关技术计算了各台站对之间的波速变化及时空分布特征,讨论了波速变化与信号频带之间的联系、波速变化的可能机理和环境气候因素等对介质变化的影响。
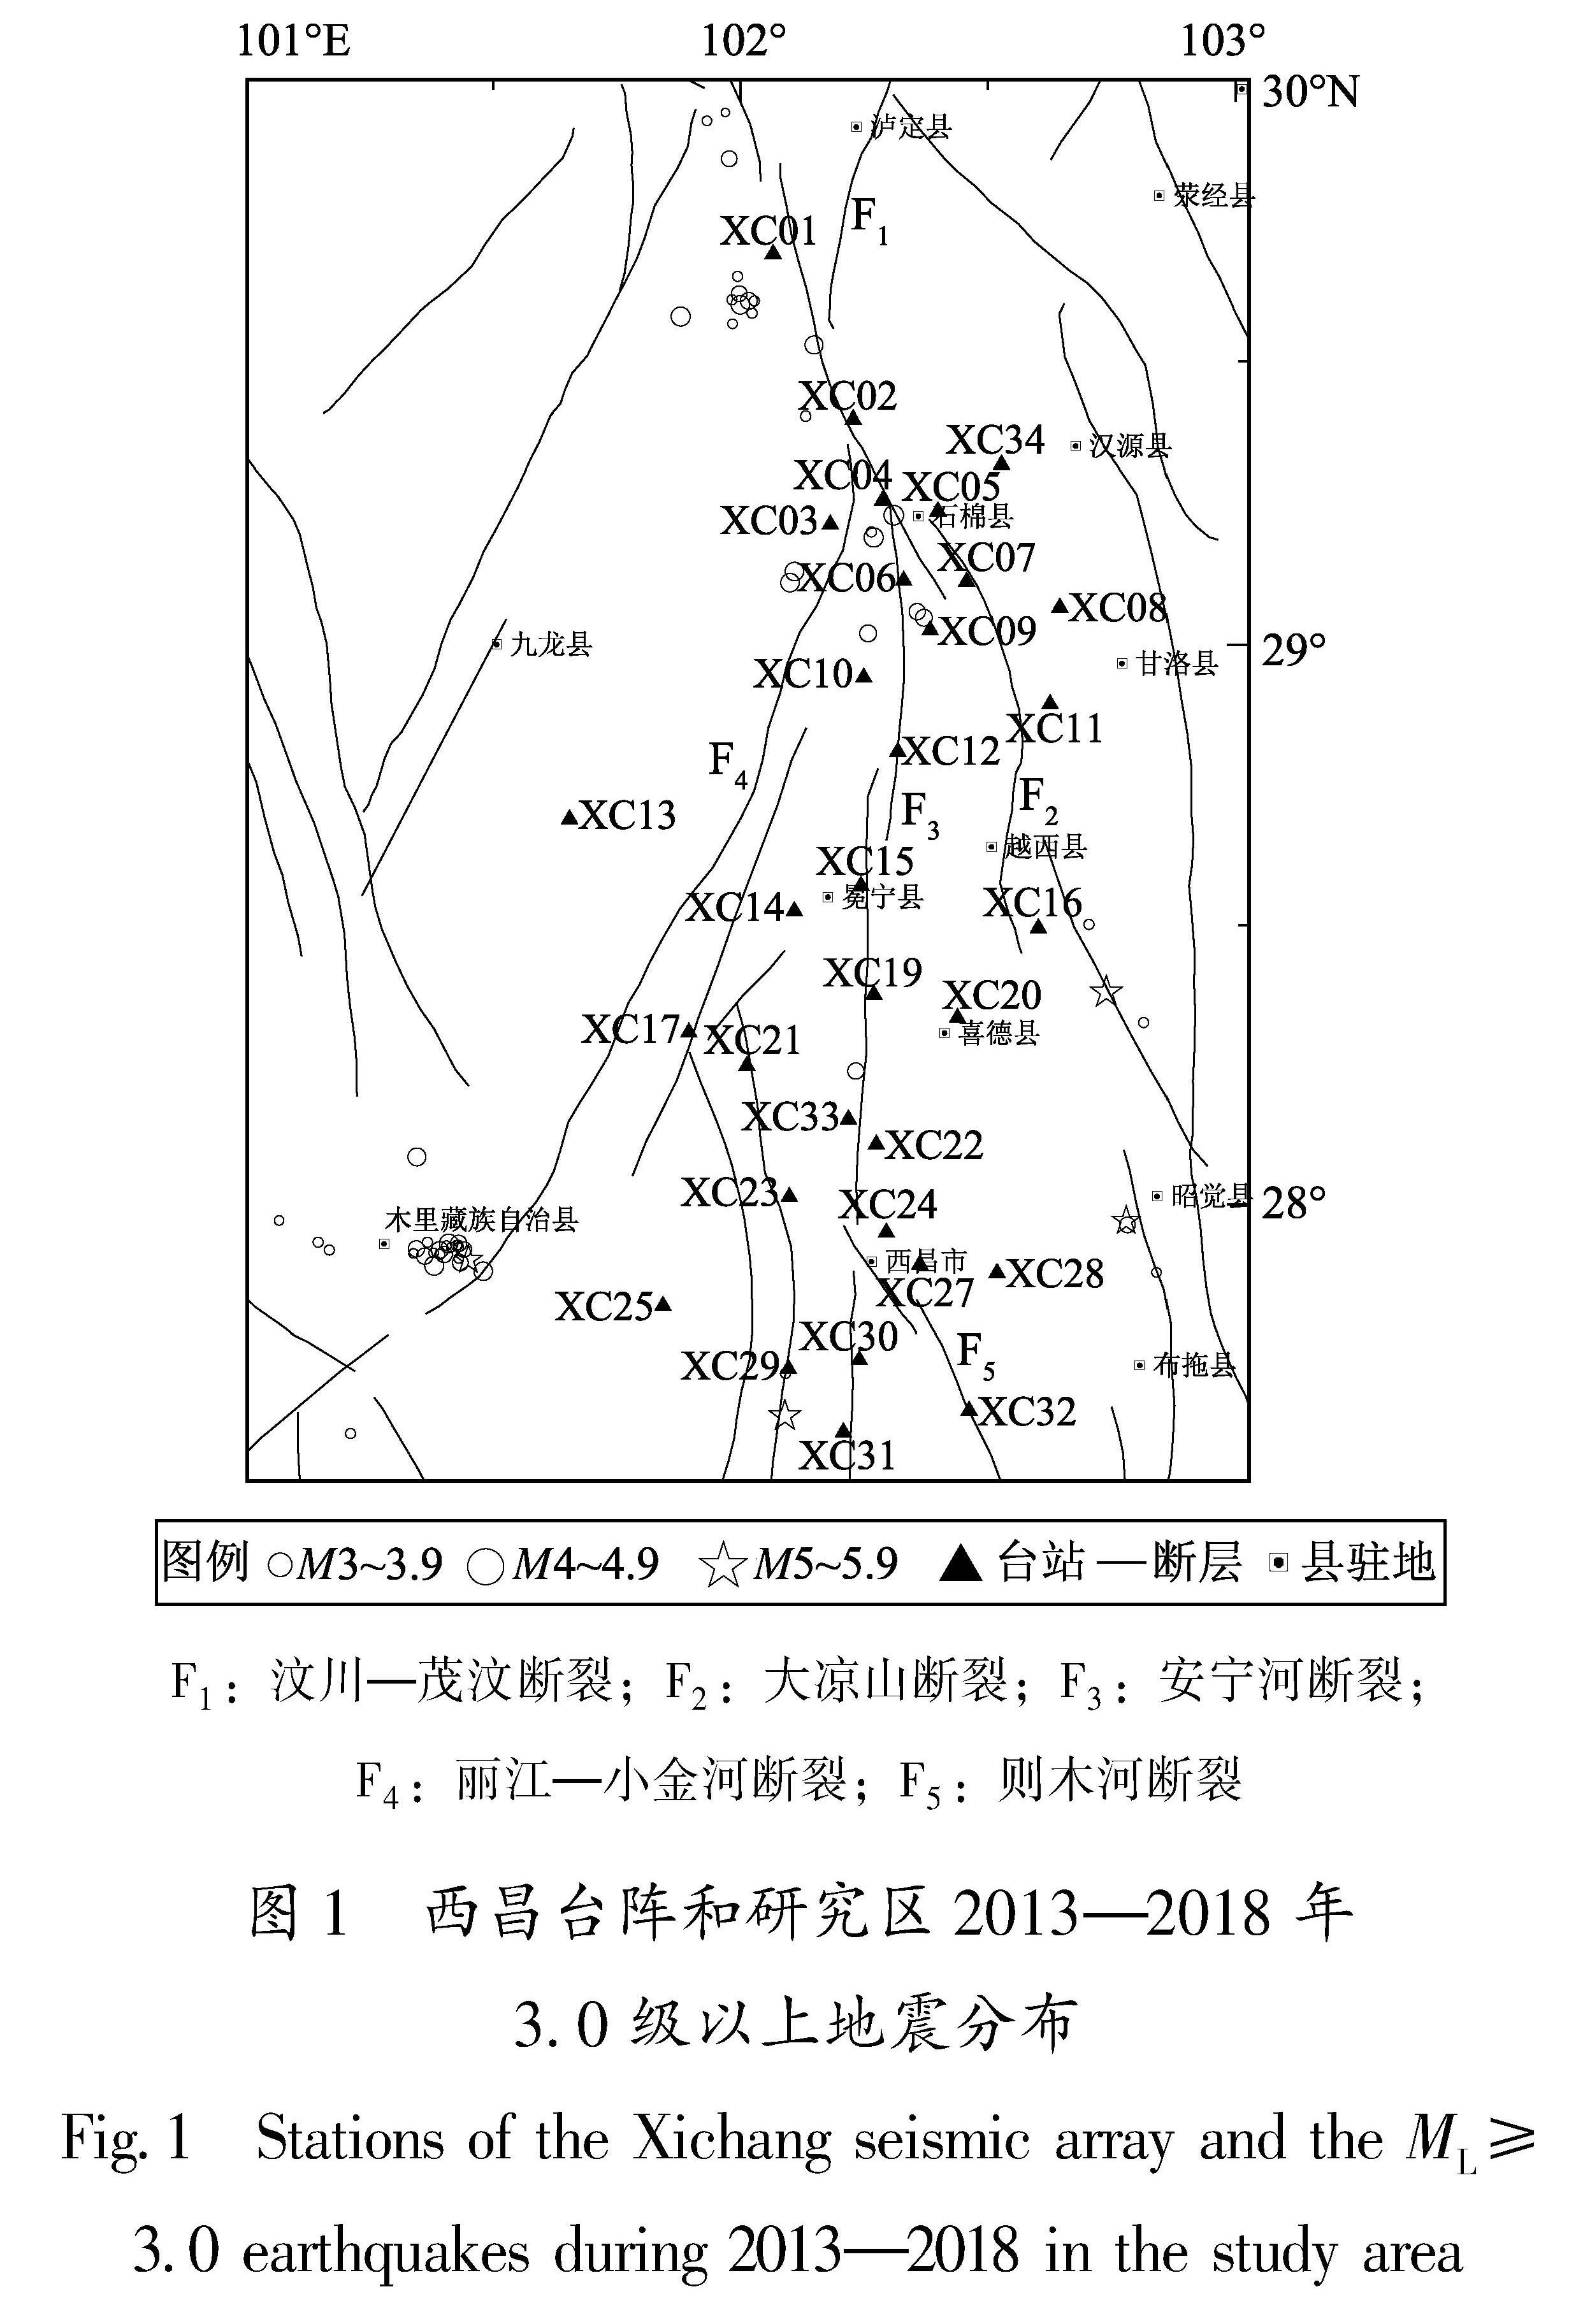
西昌台阵主要布设在鲜水河断裂带南段、安宁河—则木河断裂带北段,包含36个宽频带地震仪,仪器记录起始于2013年1月。考虑到数据缺失会影响波速变化计算的精度,本文选用了2013—2018年西昌台阵中23个连续性较好的宽频带地震仪(图1)记录的连续波形数据。数据预处理参照Liu等(2014)的方式进行:对每天的三分量波形进行10 Hz的重采样; 为了降低地震信号、仪器周边干扰及其它非稳态噪声源的影响,得到高质量的单台背景噪声记录,对重采样波形记录进行了0.02~1.0 Hz带通滤波、时域归一化处理及0.05~1 Hz频带谱白化处理。
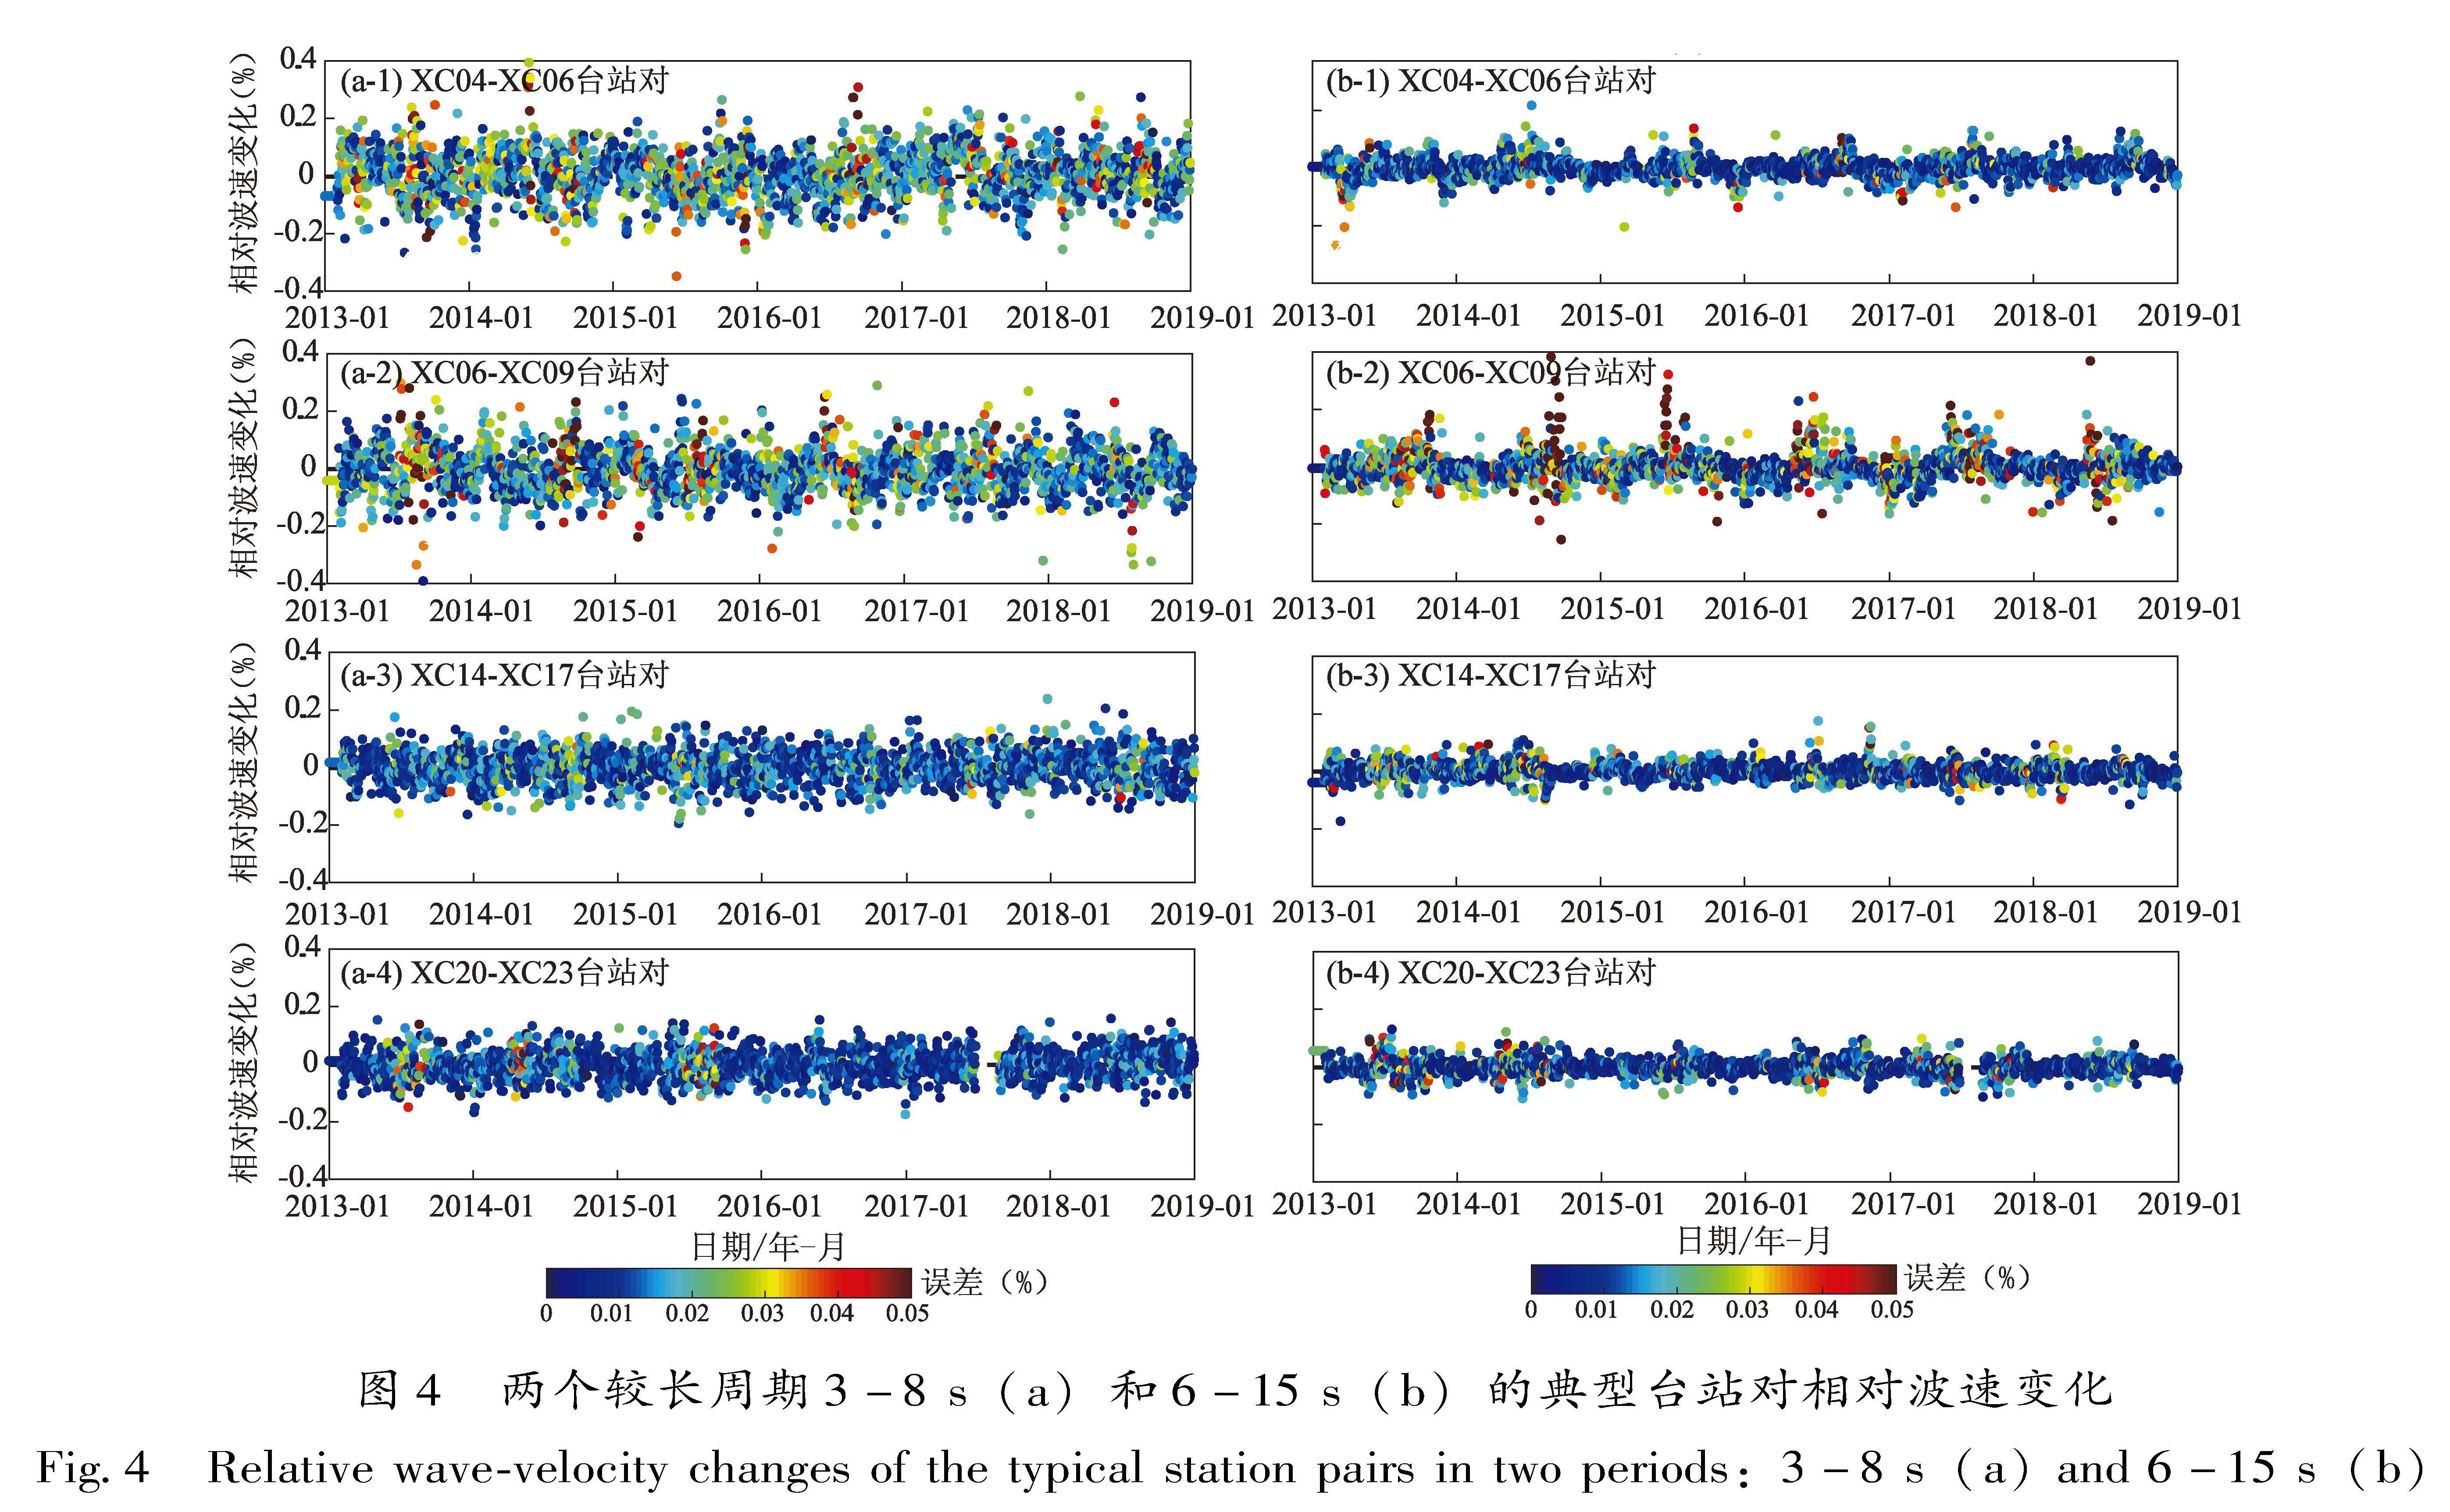
当台间距较大时,很难在短时间内稳定地重构出经验格林函数,因此本文仅对台间距小于200 km的台站对做进一步分析。我们计算了4个不同周期(1~3 s,3~8 s,6~15 s及8~20 s)的互相关函数。为了提高信噪比,对于不同周期数据,将各台站对当天及其前、后15天(共31天)的互相关函数叠加来代表该天的经验格林函数,而参考经验格林函数则由各台站对2013—2018年整个研究时段的互相关函数进行叠加得到。
图1 西昌台阵和研究区2013—2018年3.0级以上地震分布
Fig.1 Stations of the Xichang seismic array and the ML≥3.0 earthquakes during 2013—2018 in the study area
Froment等(2010)研究发现噪声源的季节性变化会严重影响噪声互相关的面波信号,而其对尾波的影响则很小,所以本文选用噪声互相关函数的尾波部分估算地震波速变化。参照Liu等(2018)的测试结果,在1~3 s周期,选取瑞利波到达后30~90 s的时间窗来计算dt; 对于3~8 s周期,dt的时间窗为瑞利波到达后的40~130 s; 6~15 s及8~20 s周期计算的dt时间窗则分别为瑞利波到达之后的40~160 s和50~200 s。不同周期的dt计算窗口的选择如图2所示,图中白色粗实线为各周期的平均瑞利波走时曲线,两条白色虚线之间的部分即为该周期计算dt所选择的信号时窗。
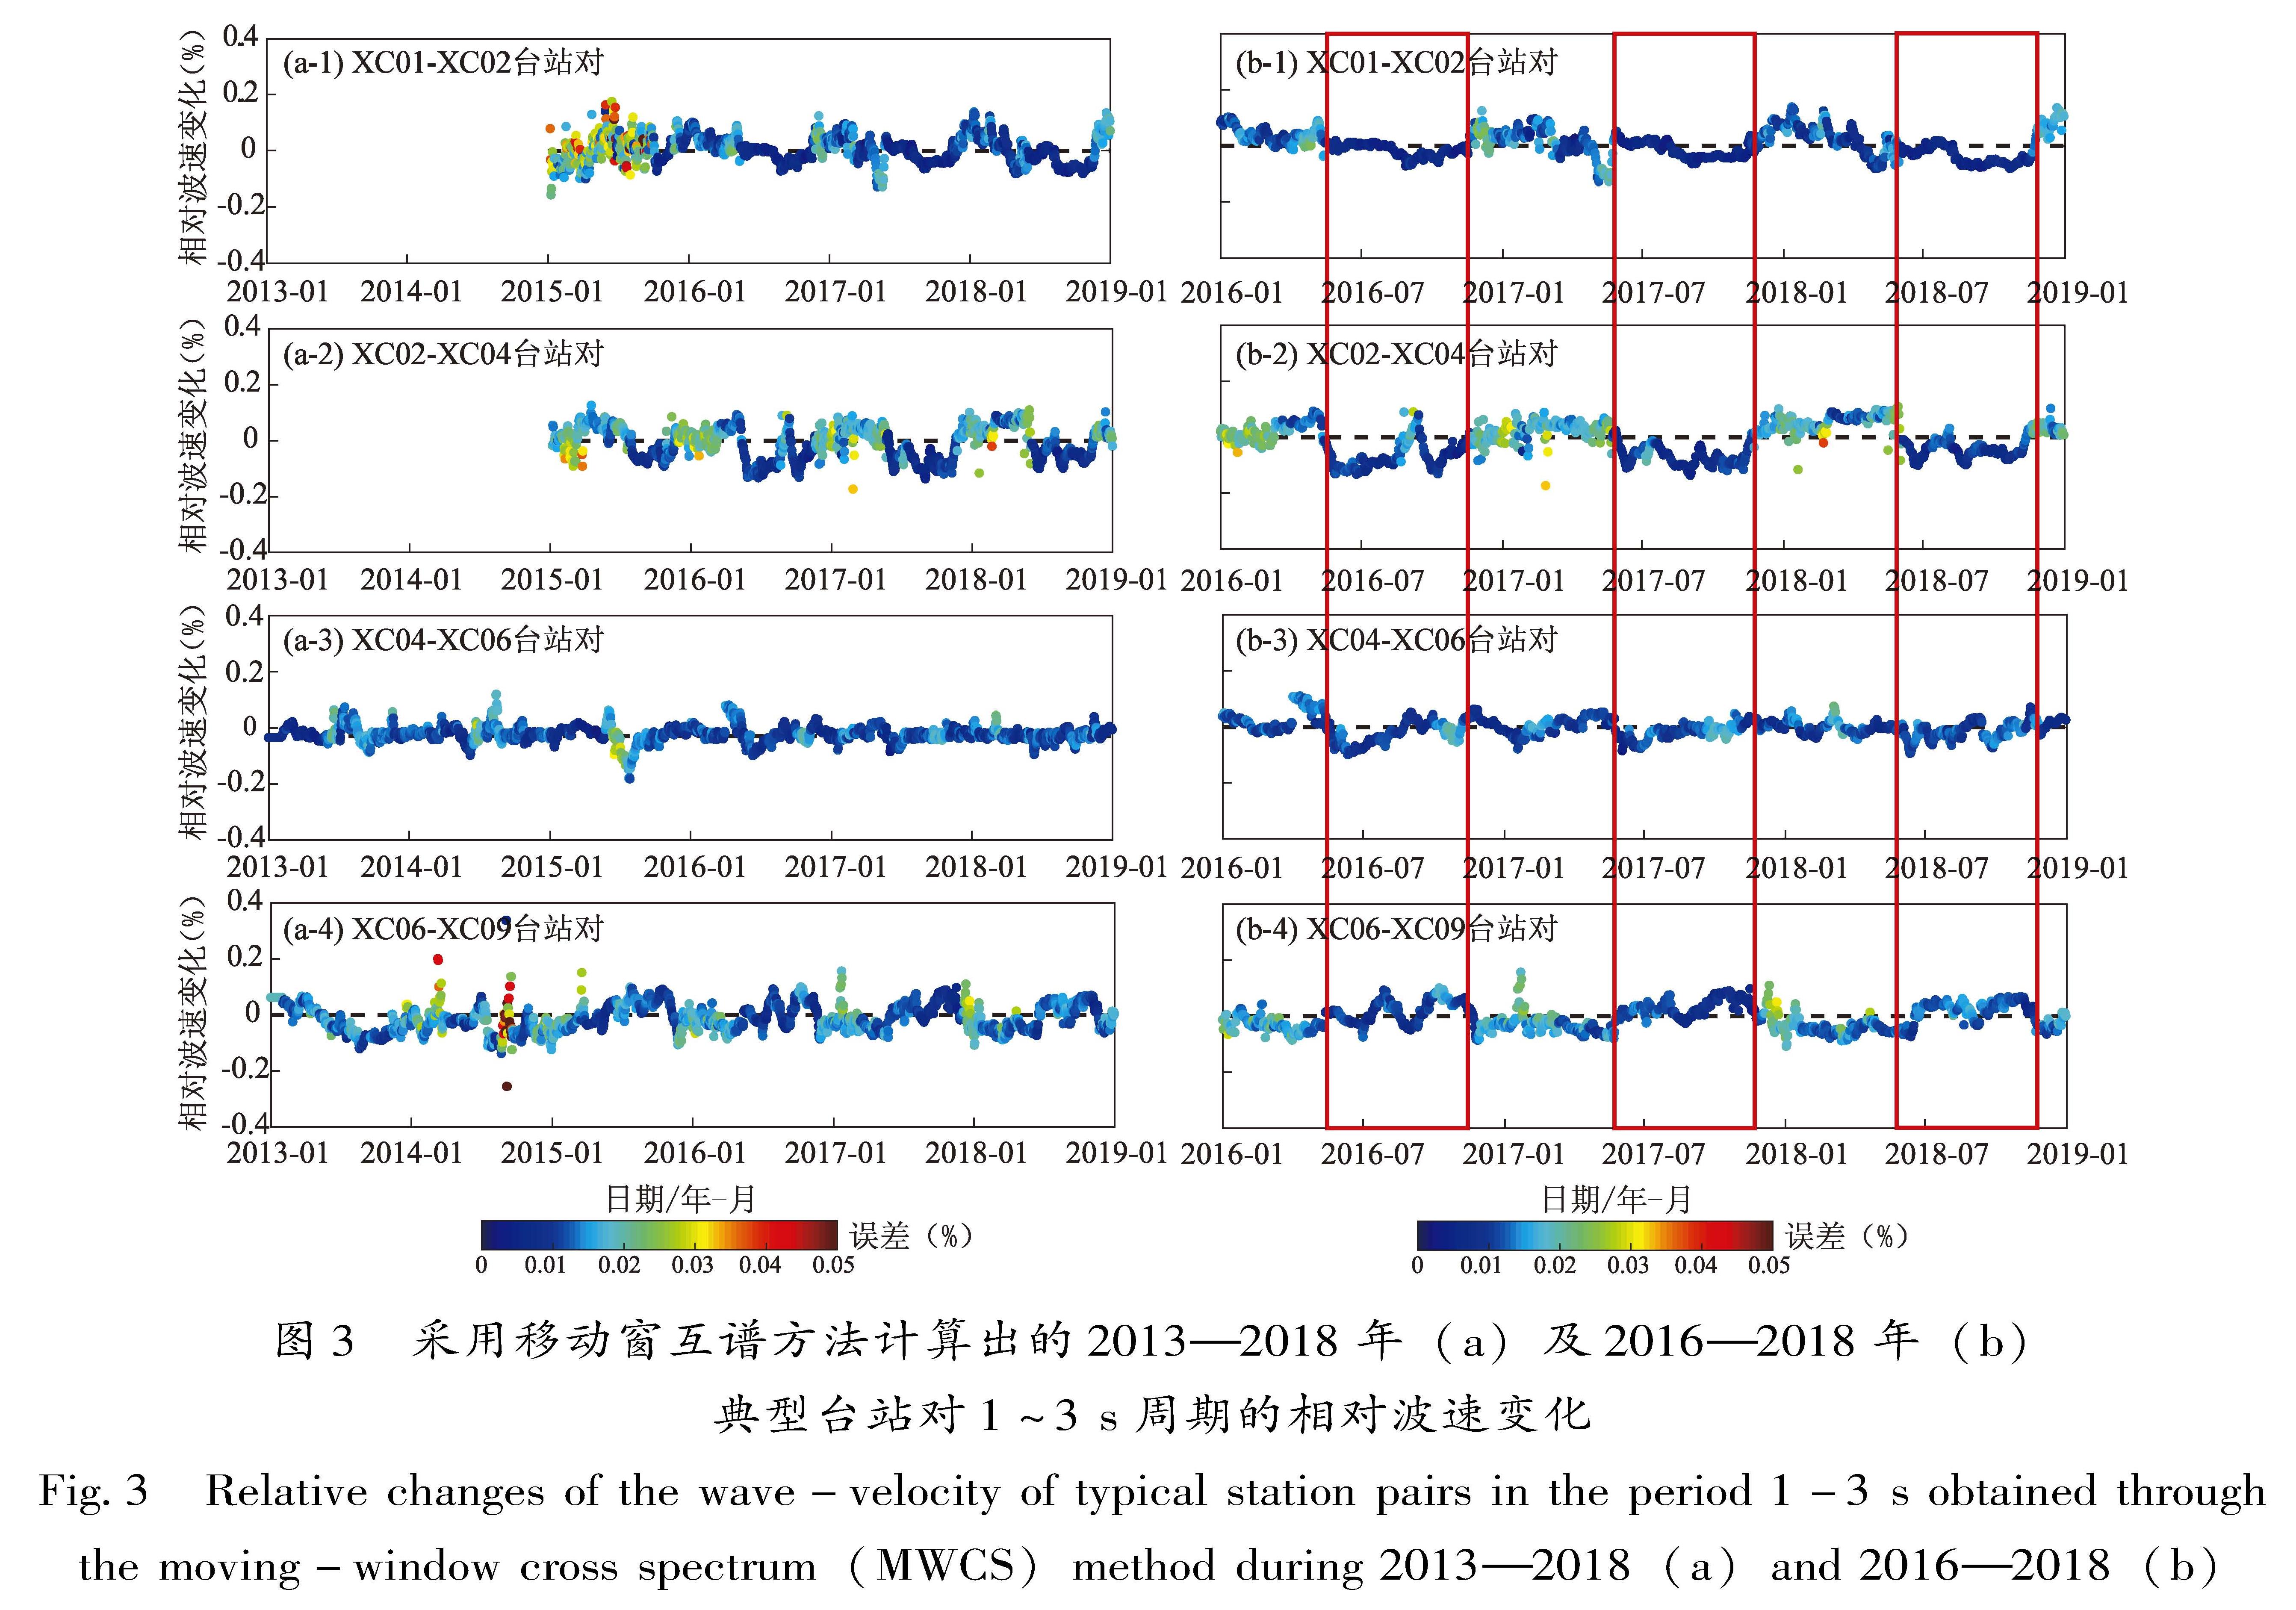
假设地壳介质相对地震波速在空间上是均匀变化的,相对波速变化可以通过 测量每天的经验格林函数与参考经验格林函数 之 间 的相对走时偏移来获得,即dv/v=-dt/t(Sens-Schönfelder,Wegler,2006; Snieder et al,2002)。获取走时偏移的方法主要有两种:一是频率域的移动窗互谱方法(Poupinet et al,1984; Brenguier et al,2008a,b; Clarke et al,2011)。它将用于计算的经验格林函数尾波部分分成若干个相互重叠的窗口,再将每个窗口信号变换到频率域,通过互相关谱的计算得到走时偏移,进而获得波速变化; 另一种是时间域的压缩—拉伸方法(Lobkis,Weaver,2003; Sens-Schönfelder,Wegler,2006)。 该方法通过适当拉伸或压缩每天的经验格林函数,以使经验格林函数与参考经验格林函数的相关性达到最大,进而获得波速相对变化。噪声的季节性变化会干扰压缩-拉伸方法的测量结果(刘志坤,黄金莉,2010; Zhan et al,2013)。因此,本文采用移动窗互谱方法计算相对走时偏移dt/t。
图3展示了采用移动窗互谱方法计算出的2013—2018年部分典型台站对1~3 s周期的相对波速变化。图3a中各台站对相对波速变化呈现出明显的周期性变化:每年6—10月,相对波速变化显示出缓慢的降低趋势,计算误差也较小,这种降低趋势在图3b中更加明显,如红色矩形框所示。每年的1—5月,相对波速呈现出无规律的随机变化特征,并且在随机变化的时段计算误差相对也较大,如图3中暖色所示。部分台站对相对波速出现较大误差,如图3中暗红色标示,经异常核实发现,较大误差是由于该台站对在此时间段波形数据缺失,用于当天经验格林函数叠加计算的天数不足31天,从而导致信噪比较低,计算误差偏大。
典型台站对3~8 s周期的相对波速变化如图4a所示。各台站对的相对波速变化总体呈现出无规律的随机性:不同位置的台站对在不同时间段内,相对波速变化在(-0.4%,+0.4%)范围内呈弥散性分布。3~8 s周期相对波速变化结果中XC04-XC06部分时间段计算误差较大,主要
图3 采用移动窗互谱方法计算出的2013—2018年(a)及2016—2018年(b)典型台站对1~3 s周期的相对波速变化
Fig.3 Relative changes of the wave-velocity of typical station pairs in the period 1-3 s obtained through the moving-window cross spectrum(MWCS)method during 2013—2018(a)and 2016—2018(b)
图4 两个较长周期3-8 s(a)和6-15 s(b)的典型台站对相对波速变化
Fig.4 Relative wave-velocity changes of the typical station pairs in two periods:3-8 s(a)and 6-15 s(b)
是由于XC06台站缺少波形数据。其它台站对的相对波速变化的计算误差较低,表明了该周期相对波速变化计算结果的稳定性。图4b展示了6~15 s周期的相对波速变化,相比于3~8 s周期的结果,该周期相对波速变化趋于平缓,基本围绕在零值线附近波动; 8~20 s周期的相对波速变化呈现出与6~15 s周期相同的特征。而XC06-XC09台站对之间出现了误差较大的相对波速变化异常,经检验发现是由XC09台站部分时段数据缺失所致。
对于各台站对的相对波速变化时间序列,我们仅在1~3 s周期观测到季节性波动,其它3个周期的相对波速变化均未呈现出明显的规律性分布。为了更好地确认1~3 s周期相对波速变化的季节性变化特征,将2016—2018年每年1—5月和6—10月的各台站相对波速度变化分别叠加平均,得到各台站对之间平均波速变化的空间分布(图5)。图5a中干季(1—5月)的台站对平均波速变化显示整体波速变化的增大或减小都较大,且有一定的空间分界特征:29°N以北的台站对的平均波速变化以增大为主,29°N以南的台站对的平均波速变化以减小为主。相比于干季的平均波速变化,湿季各台站对的平均波速变化明显减弱,仅有部分台站对出现微弱的平均波速度增大或减小(图5b),说明该地区的平均波速变化受气候影响显著。
2018年5月16日四川省石棉地区接连发生了3次地震(MS3.3、MS4.5、MS4.3)。为了更好地探究地震对震源区周围介质的影响范围,本文以石棉MS4.5地震为例,分别计算了地震前2个月(2018年3月15日—2018年5月15日)和地震后2个月(2018年5月17日—2018年7月17日)各台站对的平均波速变化(图6)。图6a显示,地震前XC06-XC34、XC02-XC05与XC05-XC08台站对平均波速明显增大,而XC04-XC06、XC04-XC07、XC07-XC09与XC07-XC34台站对波速显著降低。地震后XC04-XC06与XC07-XC08台站对出现明显的波速降低现象,XC07-XC34台站对的波速继续降低(图6b),XC06-XC34台站对的波速增大现象消失,XC08-XC09台站对则由震前的波速降低转变为震后的波速增加。
总体来说,波速变化主要局限在震源区较近范围内,且随着台站对之间距离的增大,波速变化的平均效应增强,即台间距较大的台站对呈现相对弱的波速变化。
图5 2016—2018年台站对1~3 s周期干(a)、湿(b)季平均波速变化空间分布
Fig.5 The spatial distribution of the mean values of relative wave-velocity changes in 1-3 s period in the dry(a)and wet(b)seasons from 2016 to 2018
图6 石棉MS4.5地震前(a)、后(b)两个月内平均地震波波速变化的空间分布
Fig.6 The spatial distribution of the mean values of relative wave-velocity changes two months before(a)and after(b)the Shimian MS4.5 earthquake
前人研究结果表明波速变化可能受季节性变化影响较大(Sens-Schönfelderand,Wegler,2006; Hobiger et al,2016; 王俊等,2020)。图3也显示1~3 s周期的相对波速变化具有明显的季节性变化特征。为了更好地研究波速变化与环境因素之间的联系,将石棉地震震中周边地区的相对波速变化与汉源气象站的日降水量数据进行比较,降雨量使用中国气象局数据中心提供的距离石棉地震区最近的汉源气象台数据。对比不同位置的台站对相对波速变化与降雨量(图7)可以发现:每年的湿季(6—10月)波速变化平缓,干季(1—5月)波速变化剧烈且随机。尤其是2018年湿季,降雨量明显增多,波速降低明显,湿季过后地震波速开始缓慢回升。
水力作用对地震波速的影响引起了学者的广泛关注,地下水和降雨会导致地震波速度降低0.01%~0.1%(Sens-Schönfelder,Wegler,2006; Meier et al,2010; Wang et al,2017; Lecocq et al,2017; 胡淑芳等,2021)。随着降雨量的增加,雨水渗透到地下致使地壳最上部数百米深度范围内孔隙压力增大,进而导致了剪切模量的降低与地震波速的减小。Wang等(2017)在对日本波速变化的研究中发现了幅度高达10-4的季节性变化,并将这种夏季波速的降低归因于强降雨导致的地壳流体孔隙压力的增大。谢凡等(2020)在滑坡监测中也发现降雨导致介质内部的流变特性的改变,特别是其内部颗粒体间含水量的增大,介质内部有效应力的降低,从而导致波速随弹性模量下降而下降。本文采用Wang等(2017)研究公式计算了石棉地区由于降雨渗流导致的孔隙压力变化,结果表明孔隙压力的变化相对降雨量有一定的时间延迟,这是由雨水从地表缓慢渗透到地下一定深度范围内所导致的。图7中各台站对波速降低的极值与降雨量的最大值也有一定的时间延迟,据此我们推测在1~3 s周期观测到的地震波速度的季节性变化主要受到区域季节性降水影响。
图7 2016—2018年石棉MS4.5地震区周边台站对相对波速变化与降水量分布
Fig.7 The relative wave-velocity changes of the station-pairs around the Shimian MS4.5 earthquake from 2016 to 2018
大地震的发生往往伴随震源区的破坏和地表破碎带的显现。基于背景噪声的震源区介质变化研究为探测地壳深部应力的积累与释放提供了独特的视角,发现了大量同震波速降低和震后快速恢复的证据(Wegler et al,2009; Brenguier et al,2008a; Chen et al,2010; Cheng et al,2010; 赵盼盼等,2012; Froment et al,2013; Liu et al,2014,2018)。研究认为地震导致的波速变化的主要机理为浅部的动态震动(Sleep,2015)和深部介质应力状态的改变。
为了避免直达面波受噪声源强烈的季节性变化的影响,本文采用噪声互相关波形的尾波计算波速变化。噪声互相关波形尾波的早期部分主要是面波成分,因此可以通过测量不同周期的波速变化来得到不同深度的波速变化(Liu et al,2014; Wu et al,2016)。Froment等(2013)和Liu等(2014)计算了汶川震区内瑞利波对剪切波速度扰动的灵敏度曲线,发现1~3 s周期面波对3 km以上的浅层地壳更为敏感,而3~8 s和6~15 s面波周期则分别对2~10 km 和5~20 km的地壳结构更为敏感。Liu等(2018)采用10年数据对龙门山断裂带的波速变化进行了研究,发现1~3 s和3~8 s面波周期均存在明显的同震波速降低,而在6~15 s和8~20 s周期未观测到与汶川地震有关的明显信号。说明同震波速变化在短周期比较明显,反映地壳浅部物质的状态变化。本文对安宁河—则木河断裂带周边地区的地震波速变化研究发现,波速变化在1~3 s周期具有明显的季节性变化特征,在3~8 s周期未发现与地震相关的信号。
使用重复地震和噪声互相关技术的研究表明,波速瞬时变化主要限制在地壳最上部的几百米范围内(Rubinstein,Beroza,2005; Peng,Ben-Zion,2006; Wegler et al,2009; Takagi et al,2012)。地壳最浅部的这种波速变化主要与强震动下裂隙的张开有关,是一种非线性的场地响应。谢凡等(2020)在2~25 Hz的较高频带观测到了四川长宁MS6.0地震后波速的短时下降(约0.5%)以及恢复过程,认为地球表层介质受到地震影响导致颗粒间隙松动,从而使整体弹性模量下降。随后在重力以及温度场的共同作用下,介质内部颗粒间隙重新减小,导致波速变化在同震后出现快速下降,而震后介质弹性模量的恢复则促使了地震波速度复原的进程(Niu et al,2008)。为探究地震与震源区周围介质波速变化之间的联系,本文将背景噪声互相关的频带提高到1~4 Hz,进一步研究近地表物质的变化情况。结果显示,距离2018年石棉MS4.5地震震中较近的几个台站对均出现了明显的同震波速降低,随后迅速恢复的现象(图8)。随着震中距的增大,其它较远的台站对并未发现同震信号。这说明作为一个中等强度地震,石棉地震的影响范围有限,一般不会出现明显的地表破裂带,地震波速的变化更可能是由地震引起浅部裂隙的张开或闭合所致。
利用背景噪声互相关技术计算获得了2013—2018年安宁河—则木河断裂带周边地区相对波速的时空变化。结果表明,仅在1~3 s周期观测到比较显著的季节性变化,其它3个周期(3~8 s、6~15 s及8~20 s)的波速变化无明显信号特征。已有研究表明,1~3 s周期面波反映地壳之上3 km以内的介质特性,相应地,3~8 s和6~15 s周期则分别对地下2~10 km和5~20 km的结构更为敏感(Froment et al,2013; Liu et al,2014)。已有研究成果也证实,地震引起的波速变化主要局限于3~4 km的浅层地壳(Peng,Ben-Zion,2006; Wegler et al,2009),甚至只发生在地表以下数百米的深度(Rubinstein,Beroza,2005),其机制为强震引起地壳浅部裂隙产生及发展而导致
图8 邻近石棉MS4.5地震震中的典型台站对在1~4 Hz频段的相对波速变化
Fig.8 Wave-velocity changes of some typical station paris in the frequency band of 1-4 Hz around the Shimian MS4.5 earthquake
介质的物理破坏。研究区近年来中小地震频发,但未发生造成浅地表的介质严重破坏的强震。结合前文降雨量数据的分析,区域季节性降水是在1~3 s周期观测到相对波速变化的主要原因。
对于更长周期的波速变化测量,Froment等(2013)和Obermann等(2014)利用川西流动地震台阵数据检测到12~20 s周期的波速延迟变化,但Liu等(2018)在对龙门山断裂带10年尺度的波速变化研究中并未观测到较长周期(8~20 s)、与地震有关的、可靠的地震波速变化。安宁河—则木河断裂带周边地区小震活动较强,但研究时段内未发生大地震,因而不会造成断层内部及其周边岩石的严重破坏,也不会导致断层内部介质结构和应力状态的强烈变化; 另一方面,气候的季节性变化主要影响浅地表物质,降雨导致的地下孔隙压力变化也主要作用于地壳浅部。因此,我们仅在反映浅部结构特征的1~3 s周期观测到相对波速变化的季节性特征,而未能在较长周期的观测中发现明显的相对波速变化规律。
本文利用2013—2018年西昌台阵记录的连续波形资料,通过背景噪声互相关计算了安宁河—则木河断裂带及周边地区23个台站之间的相对波速变化,得到如下主要结论:
(1)地震波速变化在短周期(1~3 s)呈现出明显的季节性变化特征,短周期结果主要反映地壳最上部的介质变化,与降雨主要影响地壳最浅部具有较强的一致性,因此认为在1~3 s周期观测到的相对波速的季节性变化主要受到区域季节性降水影响。其它周期(3~8 s,6~15 s及8~20 s)没有观测到明显的波速变化特征。
(2)2018年5月16日石棉地震发生后,靠近震源区的部分台站在高频段(1~4 Hz)出现震后波速降低,而未见震源区地表破裂,推测地震波速的变化可能是由震动引起浅部裂隙的张开或闭合所致。但受观测数据和数据处理技术等的限制,目前尚未有与石棉MS4.5地震相当震级地震相关的可靠波速变化的报道。
(3)基于背景噪声互相关方法计算出的地震波速变化是台站对之间一定范围内地壳介质状态的一种平均效应,介质变化的精确时间和空间位置及物理机制都尚未有明确的论断。本文仅观测到了反映地壳最上部几千米的短周期波速变化和地震后靠近震源区部分台站对的震后波速降低,未见明显的前震信号或类似火山喷发前的前兆信号,关于介质速度能否对中小地震孕育发生过程产生明显的响应还需要进一步研究。
中国地震局地球物理研究所“中国地震科学探测台阵数据中心”为本研究提供地震波形数据,汉源气象台降雨数据来自于国家气象科学数据中心(http://data.cma.cn/site/index.html),审稿专家对本文提出了宝贵的修改意见,在此一并表示感谢。