3.1 b值、p值的空间差异性
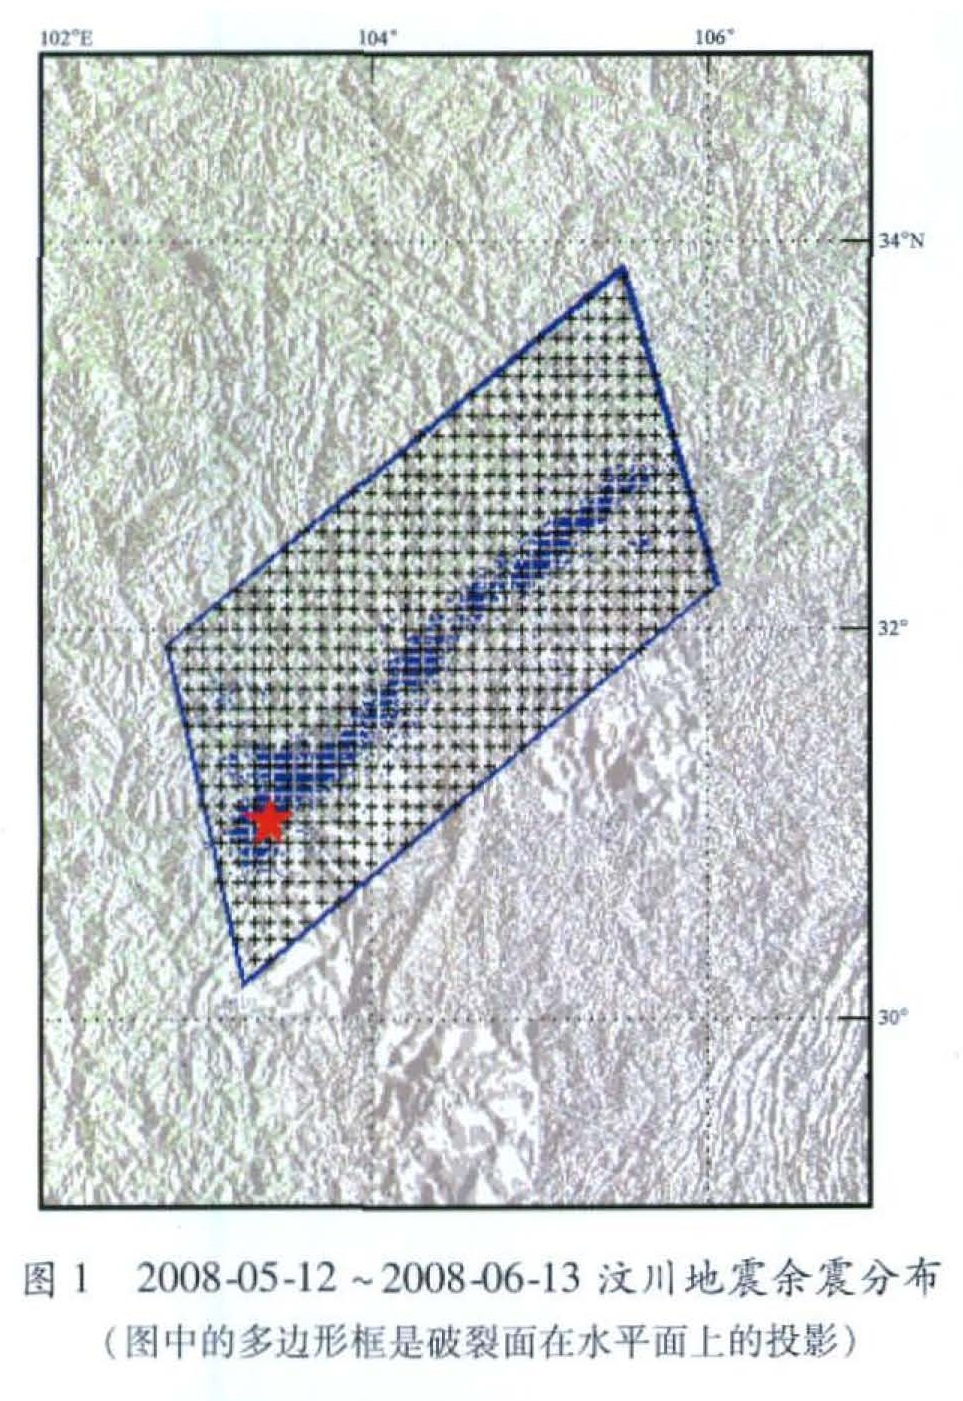
参与计算格点的b值的取值范围在0.72~1.17之间,如图2a,数字代表b值。带边框的数字表示该格点处的静态库仑应力变化的绝对值小于8 bar。b值的最大值(1.2)出现在破裂末端的正应力区,最小值(0.7)位于(31.3°N,103.3°E)附近。图2b给出静态库仑应力变化分布与p
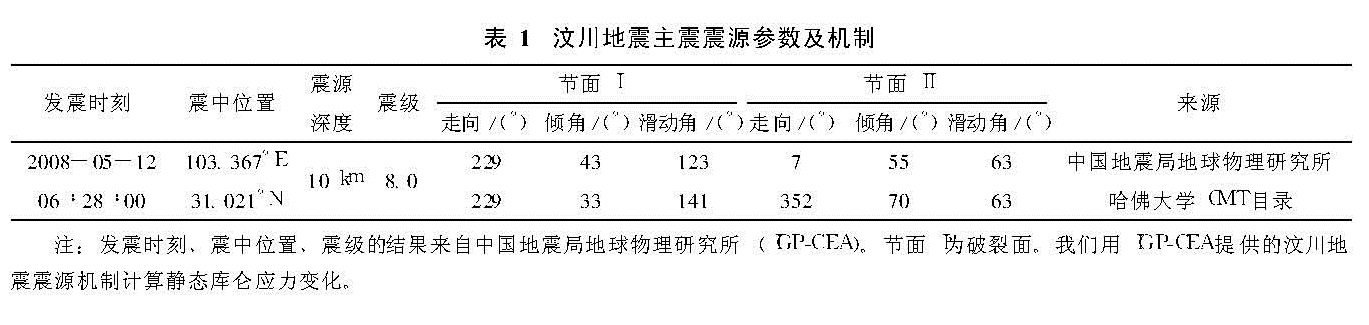
图1 2008-05-12~2008-06-13汶川地震余震分布(图中的多边形框是破裂面在水平面上的投影)
图2 静态库仑应力变化(单位:bar)分布与b值(a)、p值(b)分布
值分布,数字代表p值。带边框的数字表示该格点处的静态库仑应力变化的绝对值小于8 bar。p值的取值范围在0.53~3.47之间。
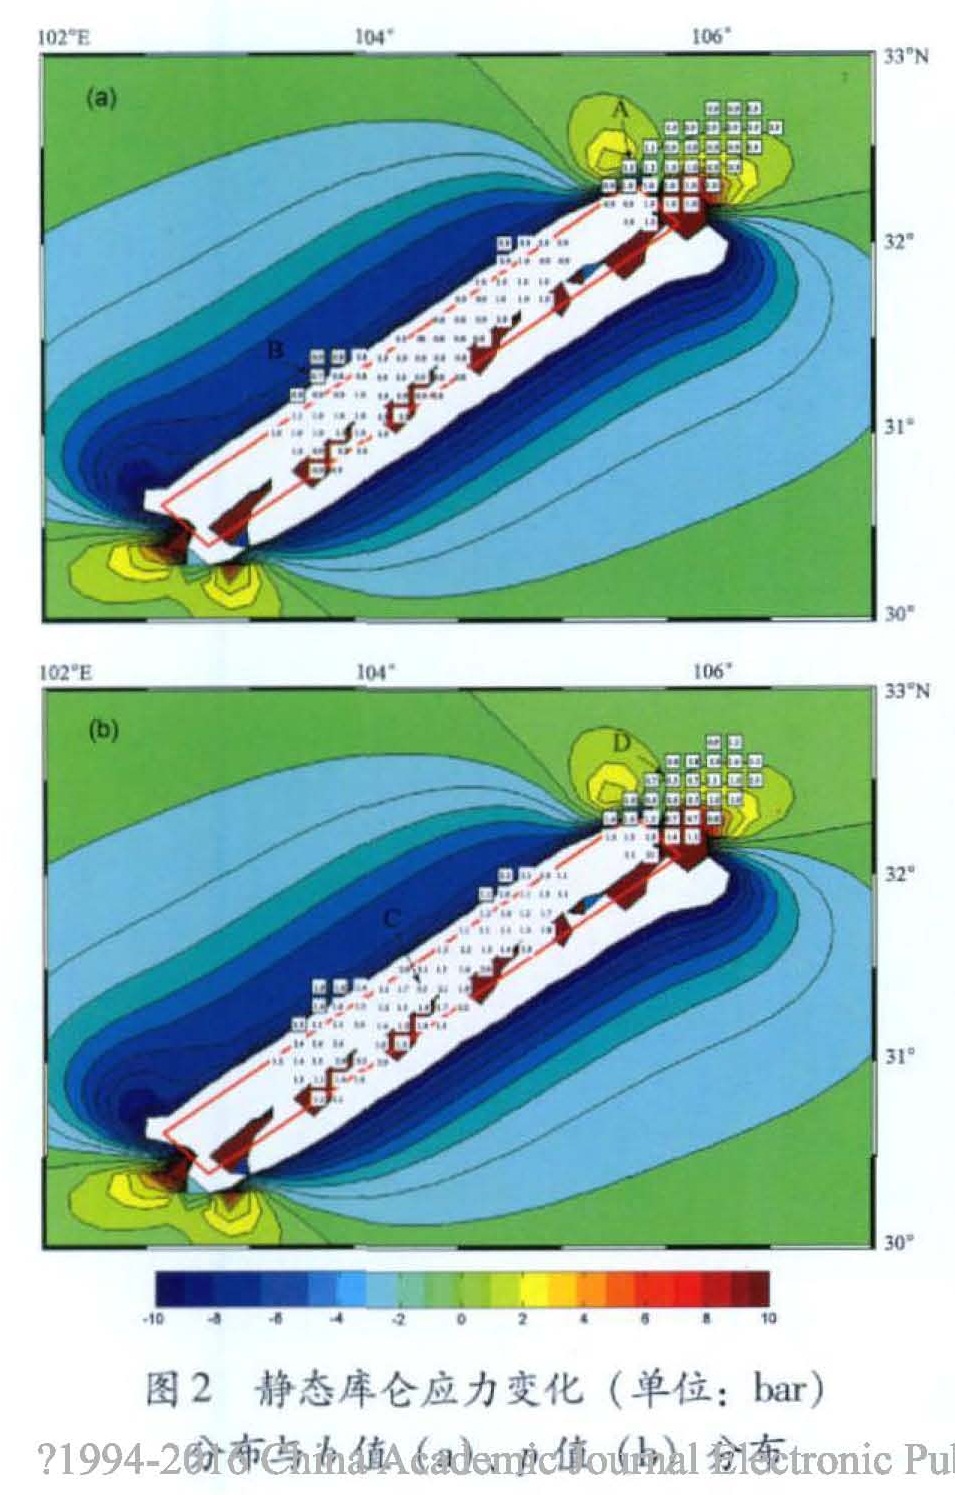
图3给出了
图2a中A、B两个格点附近区域的震级频度分布。A、B两个格点周围160个事件的选取半径分别为18.82 km和17.84 km。应用Utsu检验,得到这两个格点处b值差异的置信水平为99.9%。在破裂末端外围的p值多数小于1.0,而在破裂面投影内,p值全不小于1,最高达3.47。
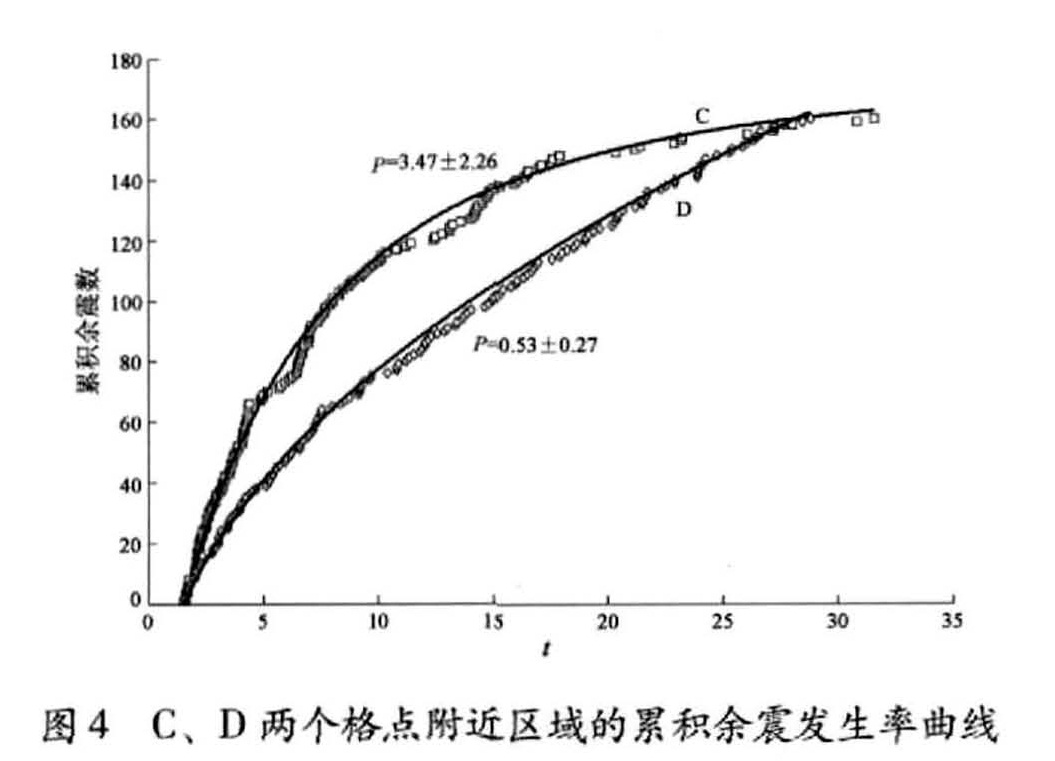
图2b处C、D两格点处的累积余震发生数如
图4所示。应用Z检验,我们也可以以99.9%置信水平判定这两个格点处的p值差异。C、D两个格点周围160个事件的选取半径分别为15.53 km和15.11 km。可以断定,汶川地震序列b值、p值的空间差异显著,不容忽视。
3.2 引起p值和b值空间分布差异的原因
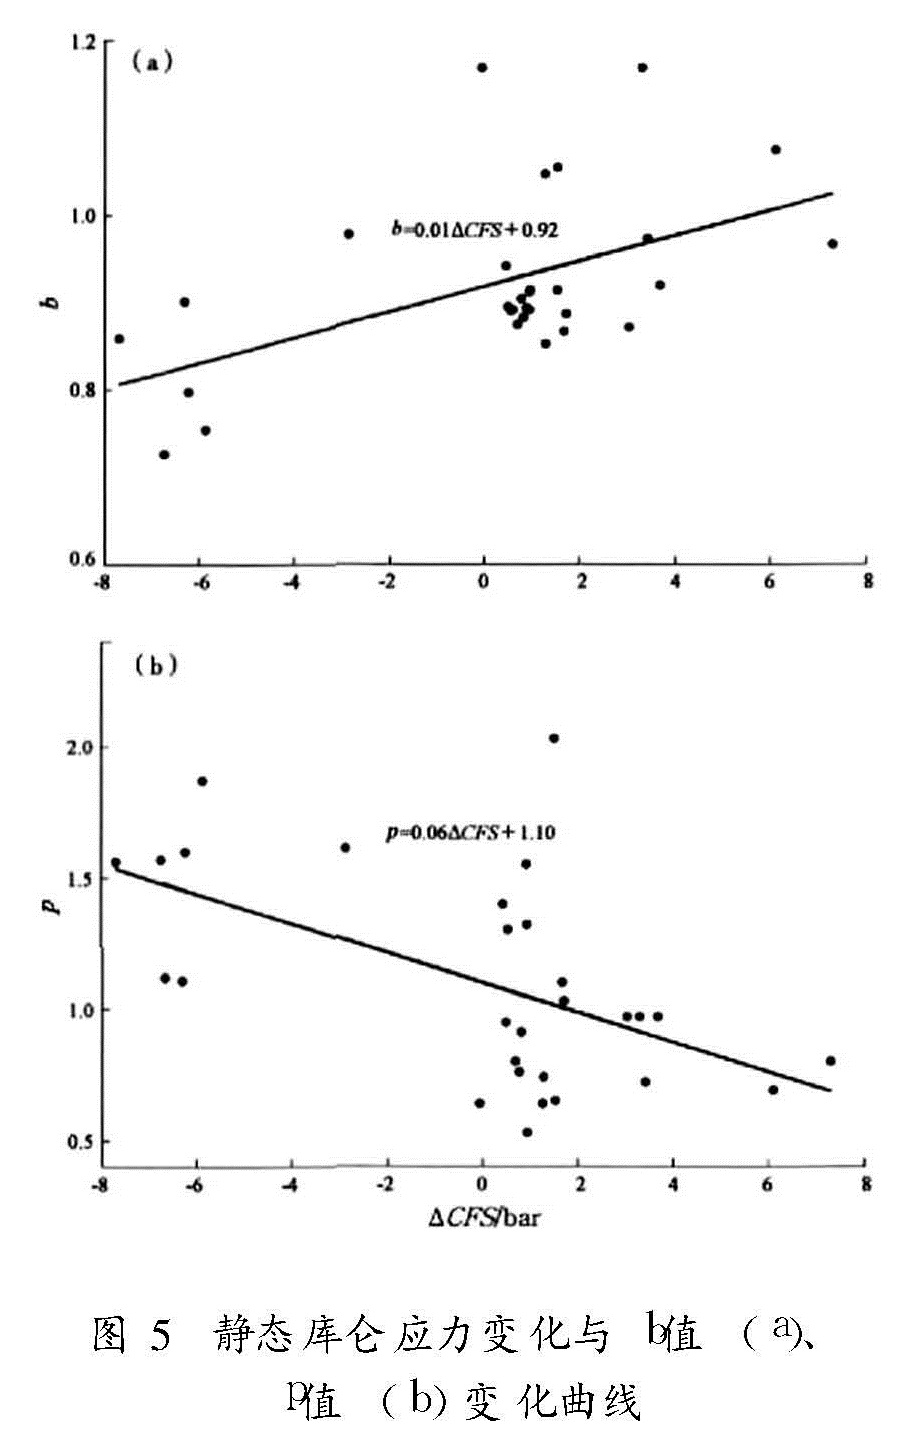
从上文分析可以看出,余震区地震活动参数的空间差异确实存在,因此,不能忽视余震特征参数在空间上的变化。图5a显示b值和静态库仑应力变化呈正相关。造成b值变化的原因主要有:(1)b值的空间分布和加载应力及介质均匀程度呈逆相关特性(Mogi,1962; Schorlemmer等,2005);(2)破裂面上,滑动位移大的区域b值较小。这是由于破裂过程中,这些区域释放了更多的加载应力,从另一角度考虑,破裂过程中滑动位移大的区域破裂程度高,裂隙长度较短,有利于小地震的发生(Wiemer等,1999)。本文研究破裂面外的地震活动性参数与静态库仑应力变化的关系,取│ΔCFS│≤8 bar,排除了破裂面周边10 km左右的范围,b值和静态库仑应力变化存在正相关性。汶川地震破裂开始以逆冲为主,后逐渐发展为以走滑为主。最小b值(图2a中B点)和最大b值(图2a中A点)分别位于逆冲和走滑区段附近。给定垂直方向应力,逆冲断层受到的平均应力较大,从而导致逆冲类型地震有较小的b值(Schorlemmer等,2005)。这可以解释A、B两点b值的差异。然而,这却不能解释汶川地震破裂东北末端的b值差异。如何解释b值和静态库仑应力变化之间的正相关性?我们可以假设破裂面周边的余震区存在无数小裂隙,而且这些裂隙也接近于发生位错。正的静态库仑应力变化将会促进这些裂隙错动,反之,则抑制其错动。从而导致正的静态库仑应力变化区小地震发生数增多,b值变大。针对本文的研究,尽管不能排除介质均匀程度对b值的影响,但也不能由此否定静态库仑应力变化对b值的作用。
和洋脊转换带相比,俯冲带有较低的p值。Davis等(1991)认为这是由于俯冲带断层强度高所致。然而,热流和p值的正相关(Kisslinger等,1991)却不能解释这类差异。汶川地震余震区在逆冲段附近有较高的p值,而在走滑段末端p值较低(图2b)。逆冲断层强度高于走滑段的断层强度,按Davis等(1991)考虑,逆冲段附近的p值应低于走滑段末端的p值,而此次地震事实却并非如此。Kisslinger等(1991)的模型可以解释汶川地震的p值分布:汶川地震余震区最大位错与主要能量都发生在逆冲段附近,如果假定断层滑动产生的摩擦热量能够影响p值分布,摩擦热量集中在高位移区引起余震衰减加快。可以看出,影响地震活动性参数分布的因素不是唯一的,而且,每类影响因素只部分解释了客观现实。Dieterich(1994)基于速率—状态断层模型,用应力变化解释了余震发生率随时间衰减的现象。因此,我们猜测,大地震发生后,余震序列内部特征参数的时空变化有可能和静态库仑应力变化有关。图5b显示p值和静态库仑应力变化呈负相关。库仑应力变化如何影响p值?正库仑应力变化增加了满足位错滑动条件的裂隙数目,但由于延迟效应,这些增加的裂隙并不是马上就发生错动,而是随时间的进行逐渐发生,反映在地震滑动性参数上就是p值减小。
图5 静态库仑应力变化与b值(a)、p值(b)变化曲线
b值和p值的变化和多种因素有关。以前人们把整个余震序列作为一个整体来研究,从加载应力、热流值、介质均匀性、断层强度等方面探究引起b值和p值变化的原因。在研究余震序列特征参数的精细结构时,受条件的限制,这些因素的变化特征在小区域内难以分辨,有必要从其它方面着手研究余震序列特征参数的精细结构。在破裂面上,把位错滑动量和b值、p值的空间变化联系起来,可以解释部分b值、p值的空间变化。迄今为止,还不能确定到底哪种因素会影响余震的发生,因此就需要从尽可能多的方面寻找影响余震活动参数的依据。笔者尝试从静态库仑应力变化的角度解释汶川地震余震区b值、p值的空间变化,发现在偏离破裂面的位置,静态库仑应力变化和b值正相关,和p值负相关。