基金项目:中国地震局三结合项目(676)资助.
(Gaotai seismostation,the seismology bureau of Gansu province,Gaotai 734300,Gansu,China)
Sato model; QC value characteristics; Linze swarm
备注
基金项目:中国地震局三结合项目(676)资助.
采用Sato单次散射模型,利用高台地震台的近场数字地震记录,研究了临泽震群序列尾波QC值在60 s流逝时间下的变化特征,得到QC值随频率的变化关系QC(f)=(27.67±2.94)f (0.9924±0.0411)。分析发现:在中等地震频发时段,QC值变化起伏较弱且偏低; 研究结果与民乐—山丹地震序列接近,故认为这个结果近似了祁连山地震带中段地区的介质特性。
By means of Sato scattering of single model and Gaotai seismic station of the near-field digital seismic records,this paper studies the characteristics of Linze swarm sequence coda QC value,also draws a conclusion of QC value changing with frequency,which is QC(f)=(27.67±2.94)f(0.992±0.0411).Analysis found that during the period of frequent middle earthquake,ups and downs of QC values is weak and QC value is low; The results of this study is similar with the Minle-Shandan earthquake sequence.So we believe that this result is similar with the medium characteristics in the middle section of Qilian mountain.
引言
尾波的存在可以认为是介质不均匀性的最明显证据之一。从Aki(1969)发表尾波散射理论,到Aki和Chouet(1975)用简单的单次散射模型解释了S波尾波的振幅衰减现象,随后,Herrmann(1980)研究发现,尾波衰减系数和S波衰减系数一致,尾波成为研究地震波衰减的一种简便有效方法。近年来,国内外地震学家广泛开展了这方面的研究工作,取得了许多有意义的研究成果。诸多研究(Chouet,1979; Jin,Aki,1986; 秦嘉政等,1989,1995,2001; 李白基等,2000,2004; 钱晓东等,2004; 王彩勤等,2004; 啜永清等,2004; 王伟君等,2004)发现,地震活动频繁地区的QC值低,地震活动相对平静地区的QC值高; 年代久远的地质单元或构造运动稳定地区QC值高,晚近代地质单元或构造活跃地区QC值低。同一个地区,较大地震发生前后QC值在时间上往往存在一些前兆性变化,这就为中强地震和地震序列中显著地震的预测提供了一个新的途径。本文利用Sato单次散射模型和高台地震台的近场数字地震记录,研究了2004年6月甘肃临泽震群序列QC值的变化特征。
1 方法与原理
依据Sato 单次散射模型(Sato,1977; Do-mingguez,Rebollar,1997),在一定频率下,尾波振幅与时间的函数关系可表示为
F(t)=lg[(AC(t)/AS)2K-1(a)]=C(f)-b(t-tS).(1)
式中:AS是S波的最大振幅,AC(t)是流逝时间t附近的尾波均方根振幅,K(a)是依赖于时间的传播因子:
AC(t)=(A2T-A2N)1/2,(2)
K(a)=1/aln[(a+1)/(a-1)]; a=t/tS.(3)
其中,AT为所取时间窗内地震波均方根振幅,AN为P波到达前适当时段的地震波均方根振幅,用以进行地震波的噪声校正(Pulli,1984; 李白基等,2004)。tS为S波到时从地震发震时刻起计算的尾波流逝时间,C(f)是与频率f有关的因子,对于特定的频率,可视为常数。b=(πflge)/Q,对于不同的频率点拟合F(t)和(t-tS)线性关系求出斜率b,即可得到该频率点的QC值。最后,由各个频率点的QC值,拟合出QC(f)=Q0f η。
2 资料处理及结果
2004年6月3日以来相继在临泽发生了6月3日ML4.4、6月5日ML4.5、6月6日ML3.7、6月7日ML4.3、6月10日2次ML4.5等显著的中等地震,已经发展成了中等地震震群,至2004年12月31日累计发生地震99次,它们在空间上呈南北向展布(图1)。
如此强烈的中等地震持续活动,在这一地区是罕见的,这也是自2003年10月25日民乐—山丹MS6.1、5.8地震以来,祁连山中东段地区最为强烈的地震活动。距离该次震群活动震中50 km范围内只有高台地震台有近场观测记录,因此我们利用该台2004年6月3日至12月31日记录到的此次震群活动的三分量数字地震记录,分析研究本次震群的QC值的变化特征。高台地震台高程为1 340 m,台基为花岗岩,使用JCZ-1型地震计,观测频带为DC~20Hz,采样率为50,数据采集器为EDAS-C24,动态观测范围为140 dB。
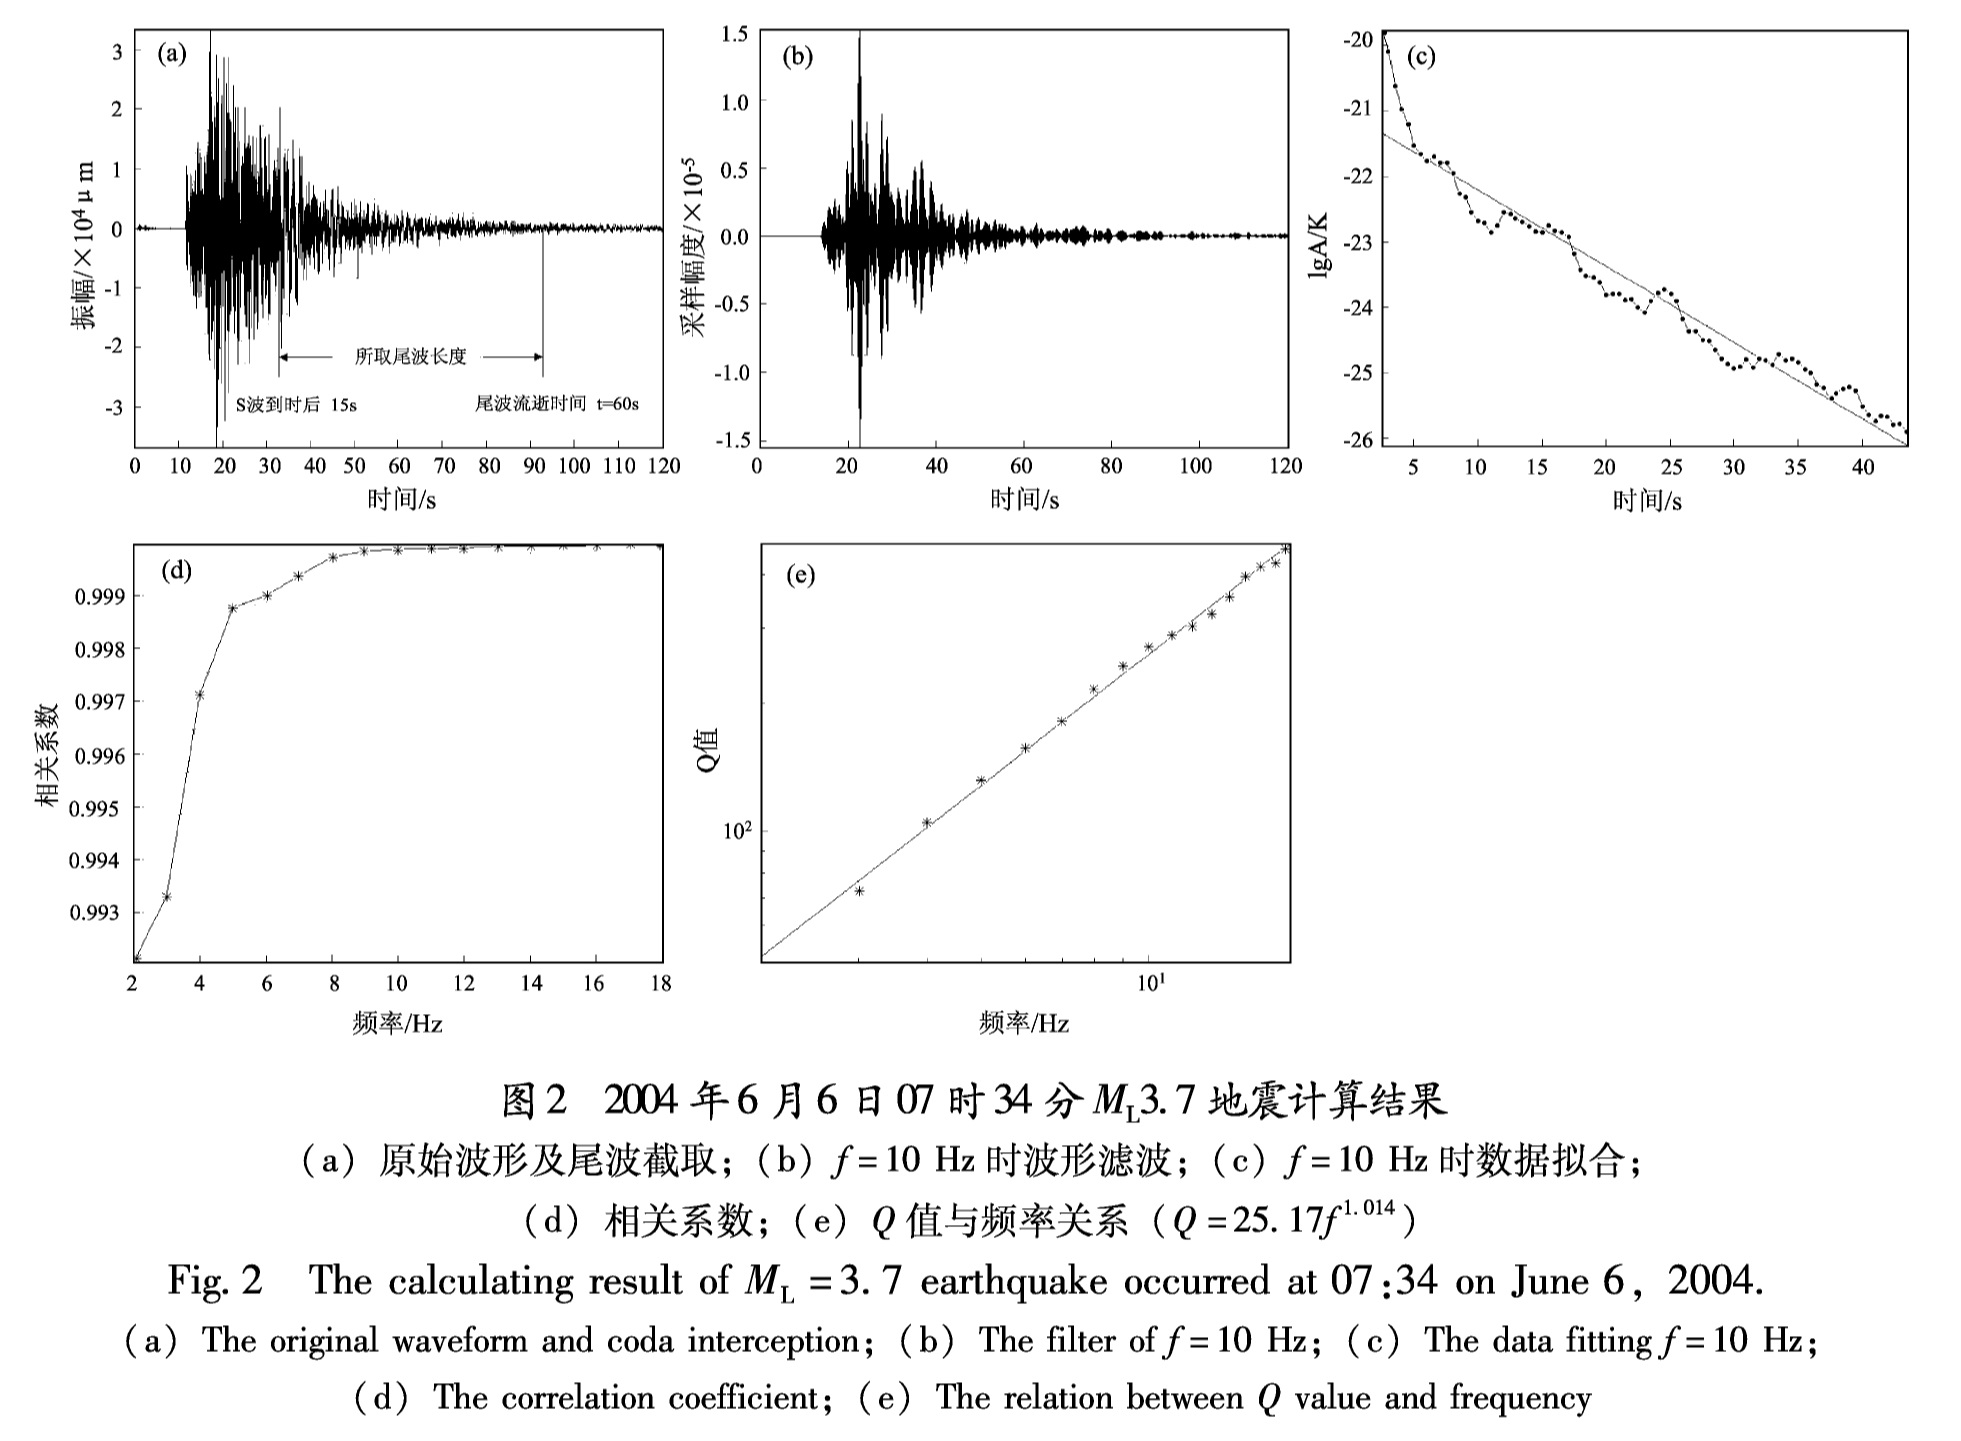
本研究采用在时间域中求取尾波Q值的方法(朱新运等,2005,2006),分析频率段为2~18 Hz,间隔1 Hz,对原始波形进行带宽[0.7f,1.3f]的6阶Butterworth滤波器滤波。对滤波后的数据,从S波到时开始,取窗长2 s,步长0.5 s滑动计算求出不同时间点的均方根振幅。因为不同的流逝时间反映了不同深度的Q值,计算时同一台站记录到不同地震所取的尾波流逝时间应尽量一致。同时,为保持线性拟合的稳定性,所截取的尾波窗长不能太短。根据高台地震台对地震序列的实际记录情况,我们选取的尾波最大流逝时间为60 s,尾波起算时间为S波到达后15 s,背景噪声取P波初动前10 s左右的平均信号。这样共挑选出符合条件的地震49次,由此可以得到各频率点Q值随时间的演化过程; 在此基础上再用关系式来拟合Q值随频率的变化关系,Q0为频率1 Hz时的Q值。图2给出了2004年6月6日07时34分ML3.7地震f=10 Hz的计算结果。
图2 2004年6月6日07时34分ML3.7地震计算结果(a)原始波形及尾波截取;(b)f=10 Hz时波形滤波;(c)f=10 Hz时数据拟合; (d)相关系数;(e)Q值与频率关系(Q=25.17f 1.014)
Fig.2 The calculating result of ML=3.7 earthquake occurred at 07:34 on June 6,2004.(a)The original waveform and coda interception;(b)The filter of f=10 Hz;(c)The data fitting f=10 Hz; (d)The correlation coefficient;(e)The relation between Q value and frequency
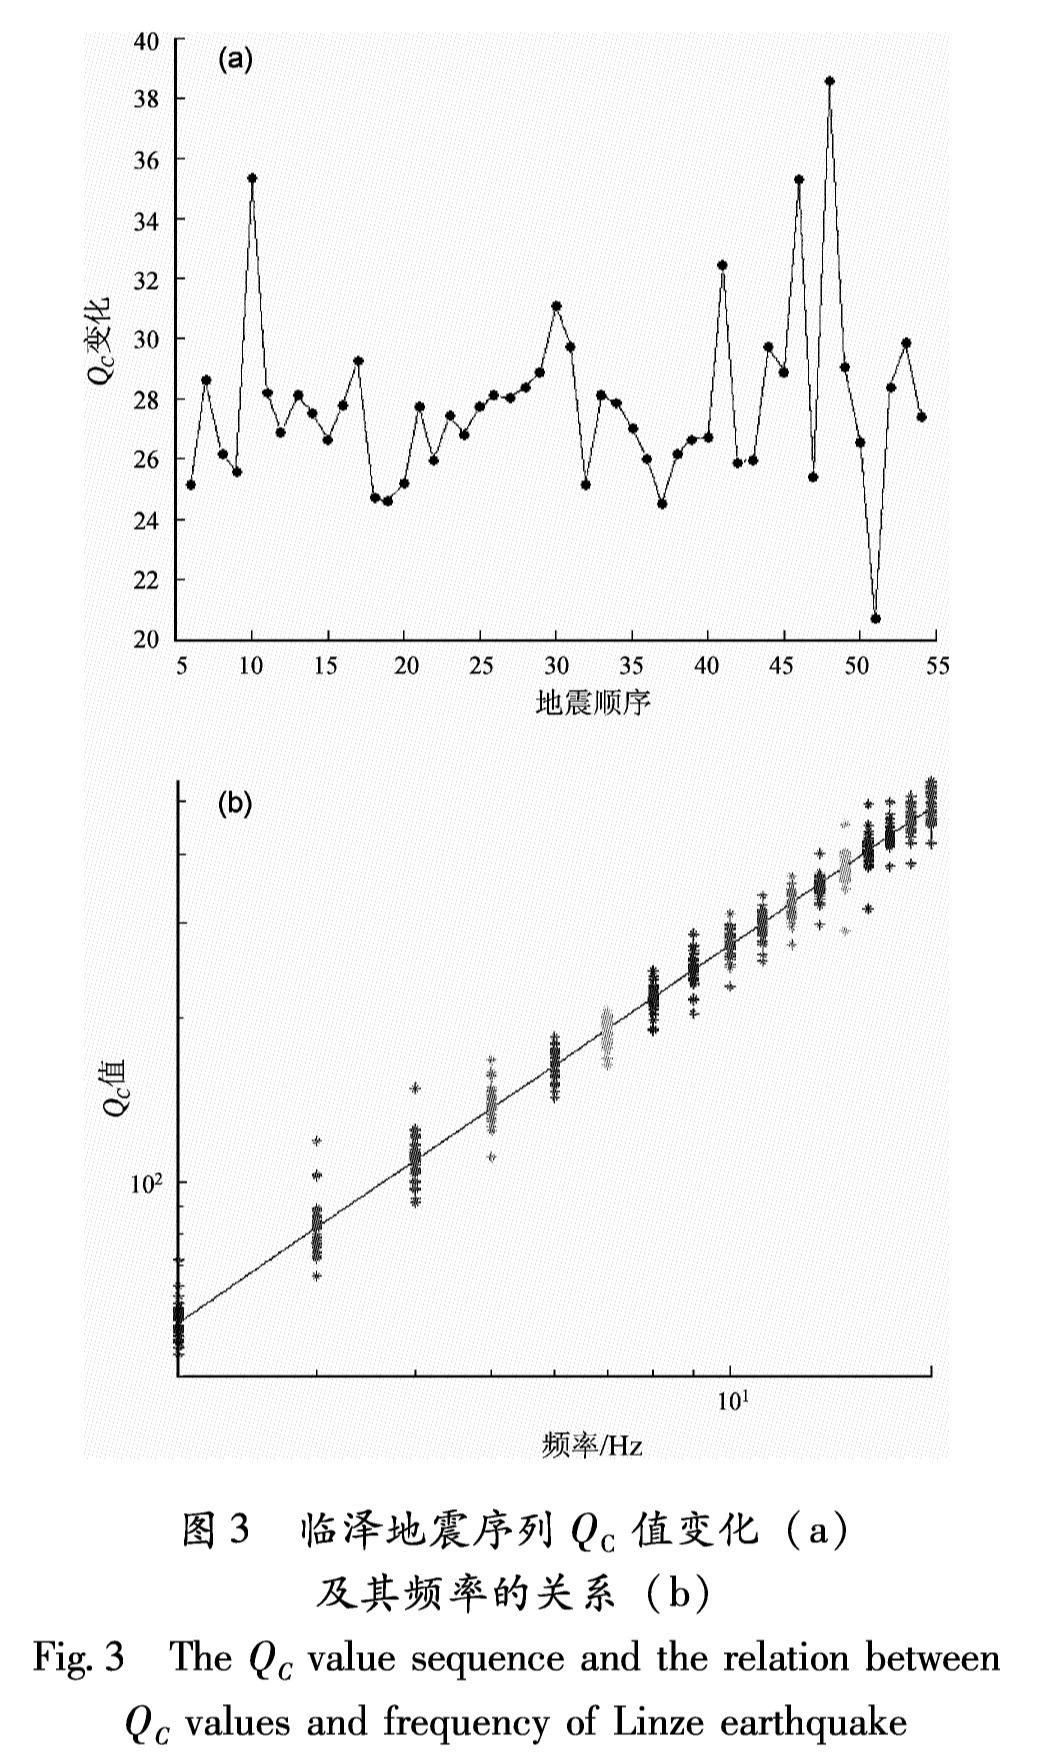
尾波QC值是通过对尾波衰减特性的研究求取区域介质因子的一种方法,QC值的大小反映了地震波衰减程度; QC值对频率的依赖程度与地壳介质均匀程度有关。我们利用Sato单次散射模型和高台地震台的近场数字地震记录,研究得到了60 s流逝时间下临泽地震序列尾波QC值的变化特征,QC值随频率的变化关系为QC(f)=(27.67±2.94)f (0.9924±0.0411)(图3),这个结果可近似体现临泽震源区的尾波衰减特征。
图3 临泽地震序列QC值变化(a)及其频率的关系(b)
Fig.3 The QC value sequence and the relation between QC values and frequency of Linze earthquake
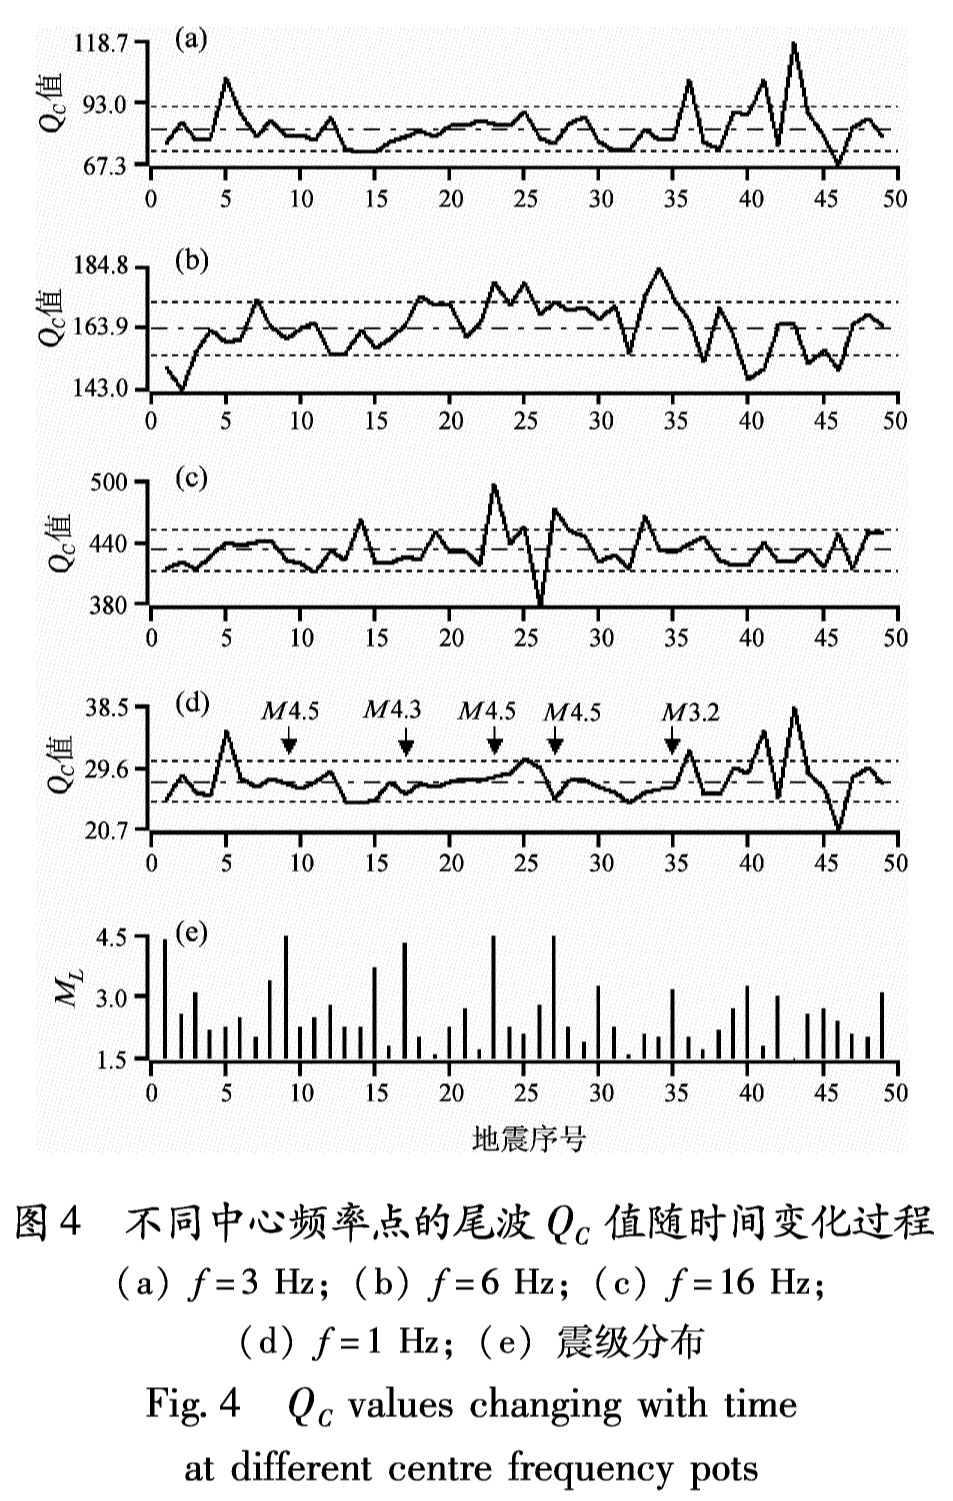
通过对不同的频率点QC值变化形态作对比发现,随着频率的增大,QC值的变化形态也会发生明显的变化。在序列的发展阶段QC值的变化起伏较大,且在高值变化。图4给出频率分别为3 Hz、6 Hz和16 Hz时QC值随时间的变化情况。从QC值演变过程看,以2004年6月14日05时16分发生的ML3.2地震为界将QC值变化分为2个时段:第一时段为整个序列的发展阶段,QC值随时间的变化起伏相对比较平稳,但地震强度较大,此期间共发生5次ML>4地震。分析该次震群序列的后4次ML>4地震前的QC值变化形态,我们发现存在“低值—高值(增大)—低值(降小)—发震”的变化形态。第二时段,QC值随时间的变化相对较大,但地震活动强度不大。分析认为是该震群打破了该地区的应力平衡状态,整个序列发展到后期,该地区的应力状态也随之调整分布。
图4 不同中心频率点的尾波QC值随时间变化过程(a)f=3 Hz;(b)f=6 Hz;(c)f=16 Hz; (d)f=1 Hz;(e)震级分布
Fig.4 QC values changing with time at different centre frequency pots3 结论与讨论
我们利用Sato单次散射模型,使用高台地震台的近场数字地震记录,研究了临泽震群序列尾波QC值的变化特征,得到QC值随频率的变化关系QC(f)=(27.67±2.94)f (0.9924±0.0411)。与国内其他研究相比,本文得出的值相对较低。按照Mogi(1962)岩石实验研究结果,一般的中小地震震群是在介质极不均匀的地区发生的,而大震的直接前震序列则是在介质不均匀的地区发生。Q值的大小与介质的均匀程度有关,因此一般的中小地震震群活动地区应具有低Q0值的特征。
对于不同中心频率点QC值变化形态不一致,随着频率的增大,QC值的变化形态也发生着明显的变化,在序列的发展阶段QC值的变化起伏较大,在序列初期和末期QC值变化起伏较弱。从本次震群的QC值演变过程看,在中等地震频发时段,QC值变化起伏较弱,QC值偏低。在ML>4强余震前QC值变化形态具有“低值—高值(增大)—低值(降小)—发震”的变化形态;
随频率的变化关系为QC(f)=(28.38±4.49)f (0.9732±0.05035),李兴坚等(2009)对比民乐—山丹地震序列尾波QC值发现,这两个结果非常接近,可以认为这个计算结果可近似祁连山地震带中段地区的介质特性。
从序列变化形态来看,两次地震序列后期QC值相对变化都较大,分析认为是由于随着地震序列的演化和发生,使得发生地震的这两个地区的应力结构状态有了新的变化和调整,进而认为临泽地震震群是民乐地震后,祁连山地震带中段地区应力调整的反应。
本研究采用浙江省地震局朱新运、中国地震台网中心刘杰研制的尾波分析软件进行计算。朱新运博士、甘肃省地震局监测中心何少林研究员给予了悉心指导和帮助。在此表示衷心感谢!
- 陈俊华,甘家思.2006.九江一瑞昌5.7级地震余震尾波QC值分析[J].大地测量与地球动力学,26(3):65-68.
- 陈学庭.1992.澜沧和耿马大地震Q值随时间的变化[M].//中国地球物理学会年刊.北京:地震出版社.
- 啜永清,张淑亮,苏燕,等.2004.大同地震序列的尾波Q值变化特征研究[J].地震,24(2):66-72.
- 郭晓,张元生,莘海亮,等.2008.青藏高原东北缘地区非弹性衰减Q值和场地响应的研究[J].地震研究,31(2):114-118.
- 韩晓明,荣代潞.2006.2004年6月甘肃临泽震群前地震学参数变化研究[J].高原地震,18(3):1-7.
- 李白基,秦嘉政,钱晓东,等.2004.云南姚安地区的尾波衰减[J].地震学报,24(1):47-52.
- 李白基,秦嘉政,谢庆茵,等.2000.云南武定1995年地震余震尾波QC值[J].地震地磁观测与研究,21(2):1-6.
- 李兴坚,许玉红,陈建军,等.2009.利用Sato模型研究民乐-山丹地震尾波QC值特征[J].西北地震学报,31(2):191-195.
- 吕坚,朱新运,高建华,等.2007.利用Sato模型研究九江-瑞昌地震序列的QC值特征.[J]大地测量与地球动力学,27(2):33-36.
- 马宏生,刘杰,张国民,等.2005.尾波QC值随时间变化在地震预测中应用的研究[J].地震,25(4):39-48.
- 毛燕,徐彦,王彬,等.2005.四川及邻区Lg尾波的Q值分布特征[J].地震研究,28(1):38-42.
- 钱晓东,李白基,秦嘉政.2004.2001年云南施甸MS5.9地震余震序列尾波QC值研究[J].地震地磁观测与研究,25(1):9-17.
- 秦嘉政,李白基,钱晓东,等.2001.云南武定地震余震近场尾波衰减的区域特征[J].地震学报,23(1):87-97.
- 秦嘉政,刘祖荫,龙晓帆.1995.滇西实验场两次中强地震前后尾波衰减的区域特征分析[J].中国地震,11(3):212-221.
- 秦嘉政.1989.云南地区短周期波区域Q值与地震烈度衰减[C].//云贵地区地震危险性研究文集.昆明:云南科技出版社.
- 王彩勤,郑斯华,刁桂苓,等.2004.张北地震序列的尾波Q值研究[J].防震减灾工程学报,24(1):37-40.
- 王伟君,刘杰.2004.1999年岫岩地震序列尾波QC的变化过程[J].地震,24(4):38-44.
- 王伟君,刘杰.2006.云南4个地震序列QC-1值变化特征对比研究[J].地震,26(1):19-25.
- 徐彦,苏有锦,秦嘉政.2004.Q值研究动态[J].地震研究,27(4):385-389.
- 张小涛,韩利萍,吕凤章,等.2007.利用Sato模型研究邢台震区尾波QC值特征[J].西北地震学报,29(3):218-223.
- 朱新运,刘杰,张帆.2006.基于Aki模型的近震S波尾波Q值求解及分析软件研制[J].地震研究,29(1):76-80.
- 朱新运,杨钢宇,张震峰,等.2005.基于Sato模型的近震S波尾波Q值求解及分析软件研制[J].地震地磁观测与研究,26(3):63-70.
- Aki K,Chouet B.1975.Origin of coda waves:source,attenuation and scattering effects[J].JGR,80:3322-3342.
- Aki K.1969.Analysis of the seismic coda of local earthquakes as scattered waves[J].JGR,74:651-681.
- Beroza G C,Cole A T,Ellsworth W L.1995.Stability of coda waveattenuation during the Lorna Prieta,California earthquake se—quence[J].JGR,100(B3):3977-3987.
- Chouet B.1979.Temporal variation in the attenuation of earthquake coda near Stone Canyon,California[J].Geophys Res Lett,6:143-146.
- Domingguez T,Rebollar C J.1997.Attenuation of coda waves at the Cerro Prieto Geothermal Field,Baja California,Mexico[J].BSSA,87(1)368-1 374.
- Herrmann R B.1980.Qestimates using the coda of local earthquakes[J].BSSA,70:447-468.
- Jin A,Aki K.1986.Temporal changes in coda Q before the Tangshan earthquake of 1976 and the Haicheng earthquake of 1975[J].JGR,91:665-673.
- Pulli J.1984.Attenuation of coda wave in New England[J].BSSA,1149-1166.
- Sato H.1977.Energy propagation including scattering effect:Single isotropic scattering,approximation[J].BSSA,68:923-948.
- Sato H.1988.Temporal changes in scattering and attenuation associ-ated with the earthquake occurrence-areviewof recentstudies on coda waves[J].Pure App Geophys,126:465-497.
- Yoshihiro H,Nobuhiko H,Muneyoshi F,et al.2000.Temporalchanges in coda Q and b value due to the static stress than-ges associated with the 1995 Hyogo-ken Nanbu earthquke[J].JGR,105(B3):6141-6151.